
Guest post by David Durman on JointJS, a JavaScript Diagramming tool (if interested in the topic of online modeling tools, don’t forget to check our list of tools). Enter David
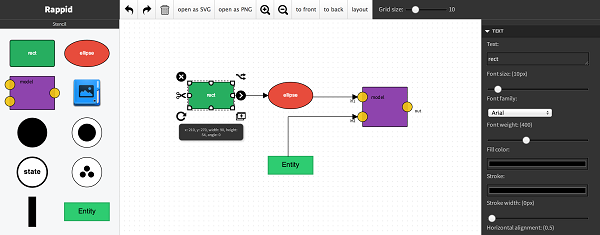
JointJS is a complete toolkit for building fully interactive diagramming and modeling applications that run in modern browsers. JointJS core library is open source. A commercial toolkit, Rappid, is available, that implements all the aspects of a diagramming application. A full feature set, documentation, the library itself and other useful information can be found on our site at http://jointjs.com. A sample demo application is located at http://jointjs.com/rappid.
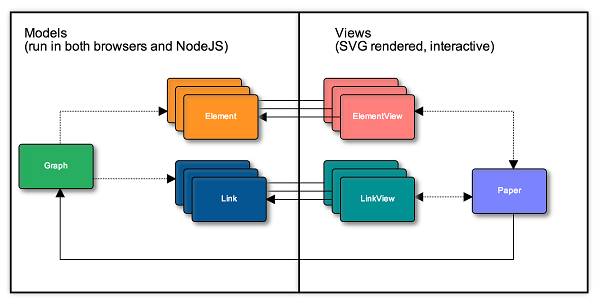
JointJS follows MVC architecture design and the programmer usually works with models, not views (as it is with graphics libraries). These models (elements and links) build up a graph which is rendered on the screen using browser native SVG (but it is possible to use HTML inside elements too). When the user interacts with the SVG document, models are updated accordingly. By listening to events triggered on the graph, the programmer can respond to all changes and perform custom actions. Graphs can be serialized to/from JSON format with single function call.
Ready-to-use shapes are available for well-known diagrams (ERD, Org chart, FSA, UML, PN, DEVS, and others) and new shapes can be either defined in a declarative fashion reusing existing SVG documents or programmatically rendered.
Commercial plugins implement a wide range of UI components such as Stencil (element palette), Command manager (undo/redo), Selection, Clipboard, Halo (element tools), Inspector, Paper scroll & pan, auto layouts and much more. We’re now finishing testing for our Channel plugin that synchronizes graphs between server and client (possibly multiple clients) which effectively implements real-time collaboration.
Our goal is to build a powerful and modern toolkit for building visual languages of various kinds. Wherever possible, we try to stick to technologies and frameworks that are known to JavaScript developers so that the learning curve stays shallow. That also means that the standard technologies (SVG, HTML 5, CSS 3) and frameworks (jQuery, Backbone MVC framework) that the programmer uses with JointJS are useful to him elsewhere. We would really appreciate your feedback and would be happy to answer all your questions.
FNR Pearl Chair. Head of the Software Engineering RDI Unit at LIST. Affiliate Professor at University of Luxembourg. More about me.


Nice tool. It’s really useful to move diagramming tasks to the web.
I’m very interested in how the layout is supported. In this kind of tools where diagrams can be created programmatically, the task of assigning positions (i.e., x and y) to the elements is usually very boring.
I have the feeling that, in general, it has to be the end-user the one that has to arrange the elements in a correct (or at least, understansdable) layout.
I’ve seen that this tool incoporates support (let’s say basic) for this. Do you plan to include more advanced layout support?
Thanks in advance!
Hi Javier,
Thanks! We’re happy to hear you like our tool. We currently support two auto-layout algorithms: Force-directed, which is suitable for undirected graphs, and one for directed, layered, graphs based on the Sugiyama framework. We plan to add more layouts in the future (e.g. Tree layout, Cluster layout and probably more). It always depends on the actual application what layout algorithm is suitable.
Thanks for the feedback! If there is a certain layout algorithm that you’d like to see in JointJS, please let us know.
Very nice library.
It would be nice if you could support linking nodes to links also. For example, to support modeling assocative classes in object modeling (a class link to an association).
thanks,
Thanks Dan, that’s indeed a good suggestion. We’d like this feature to land to JointJS 1.0 that we plan to release in the beginning of the next year. It should then be possible to link nodes to nodes, nodes to links and even links to other links.
Hi David,
nice to read that! I’ll download the tool and give it a try to know more.
Thanks!
Hi,
I looked at JointJS just recently and didn’t see the feature of auto layout. That’s good to know that now it’s partially supported. We would be especially interested in StackLayout, when elements of a container are placed one above another and stretched to match the size of the container.
Hi Tanya,
Thanks for the suggestion. Do you have any visual example of such a layout? I think I know what you mean but want to be sure we’re on the same page regarding the StackLayout. I might indeed be interesting to have this built into JointJS.
Thanks!
David,
Thank you for the prompt response. I prepared a screenshot for you, but this site doesn’t allow me to attach anything, what is the best way to give it to you?
I am interested in seeing the complete list of available commercial plugins, do you know where we can find it?
Thanks!
Tanya,
Great. You can send it to my email: [email protected]. The complete list of commercial plugins is available here: http://jointjs.com/about-rappid.
David,
JointJS is very powerful and, based on the documentation and samples, is easy to use.
My another question is about containers.
I reviewed several samples with elements looking as container:
– http://www.jointjs.com/demos/devs
– http://www.jointjs.com/demos/umlsc
They look like a node containing another element, but in fact one figure was just placed above another. For example, in the umlsc example, “sub state 4” is a sibling of “state 2“. Is that correct? Is there support for diagram containment in JointJS?
Thanks.
Tanya,
JointJS indeed supports nesting of elements within other elements to an arbitrary level. We call it “embedding” and there are basically three methods for dealing with this that are described in the API reference here: http://www.jointjs.com/api#joint.dia.Element:embed.
In the umlsc example, “sub state 4” is embedded into “state 2” and is treated as its child. In general, hierarchical diagrams can be implemented in two ways. One is using the embedding feature. The other would be creating another graph (and associated paper) on the fly and populating it with child cells (elements and links). The former is easier to implement. The latter is probably more suitable for larger hierarchies, or put differently, layered graphs/diagrams. On the UI level, you can then decide how you’d like to display the child-parent graphs.
David, thank you for pointing to this method, now I do see the “states.s2.embed(states.s4);” . I was confused by the code of the model.