

Software modeling is a key activity in software development, especially when following any kind of Model-Driven Software Engineering (MDSE) process. In this context, standard modeling languages, like the Unified Modeling Language (UML), and tools for supporting the modeling activities become essential.
But how are UML class diagrams built in practice? and how well modeling tools support modelers on this task?
In our paper recently published on the Computer Standards & Interfaces Journal (free author copy ), we employ two research approaches to analyze these questions. Our goal is to draw some useful lessons that help to improve the (UML) modeling process both by recommending changes on the tools themselves and on how UML is taught so that theory and practice of UML modeling are better aligned.
Our study is focused on two tools widely used by the community: MagicDraw (version 18.0 Personal Edition, from 2017) and Papyrus (Neon 2.0.X version, from 2017). We have chosen these tools because they are two of the most popular modeling tools and they cover a representative group of modelers. MagicDraw is one of the major commercial modeling tools, recently acquired by Dassault Systems to strengthen its set of System Engineering tools while Papyrus is the reference open-source modeling tool in the Eclipse community.
The study focuses on three research questions (RQ):
- RQ1: What modeling strategy do modelers follow to specify UML class diagrams? This RQ is centered on the approach employed to model the class diagram, i.e. the sequence of actions that are executed by the modeler to draw it. According to the focus and the granularity of the analysis, the modeling strategy can be decomposed into two sub-perspectives:
- the global modeling strategy, i.e. the general approach followed to create the whole class diagram (we define in the paper two global modeling strategies inspired in two graph theory algorithms: Breadth Modeling and Depth Modeling); and
- the specific modeling strategy, i.e. the particular approach followed to create specific parts of the class diagram such as the attributes and associations.
- RQ2: How much modeling effort (time and number of clicks) is needed to model UML class diagrams? This RQ focuses on evaluating the degree to which modeling tools support and facilitate the construction of UML class diagrams through its graphical interface. In our study, the modeling effort is evaluated in terms of time and number of clicks needed to model the class diagram. According to the focus of the analysis, the modeling effort can be studied from two points of view:
- the effort devoted to initialization tasks, i.e. the work devoted to initialize the modeling tool and create an empty class diagram; and
- the total modeling effort, i.e. the complete effort devoted to modeling the whole class diagram, including the effort devoted to initialization tasks.
- RQ3: What are the most common obstacles (difficulties and errors) encountered by modelers when modeling UML class diagrams? This last RQ is centered on the difficulties participants encountered with the use of modeling tools as well as the mistakes made by the modelers while using these tools. In both cases, obstacles have been analyzed and classified under the CRUD (Create, Read, Update and Delete) perspective, that is, the obstacles are contextualized according to whether they have arisen when the elements of the diagram are Created (C), Read (R), Updated (U) or Deleted (D).
To answer these research questions, we carried out two studies employing different research approaches. The main one is an empirical experiment supported by more than 12 hours of screen recordings (interaction with the modeling tools including verbal audio comments) registered by undergraduate students during the construction of a UML class diagram. Besides, an analytical analysis based on GOMS (Goals, Operators, Methods and Selection Rules) complements the previous experiment.
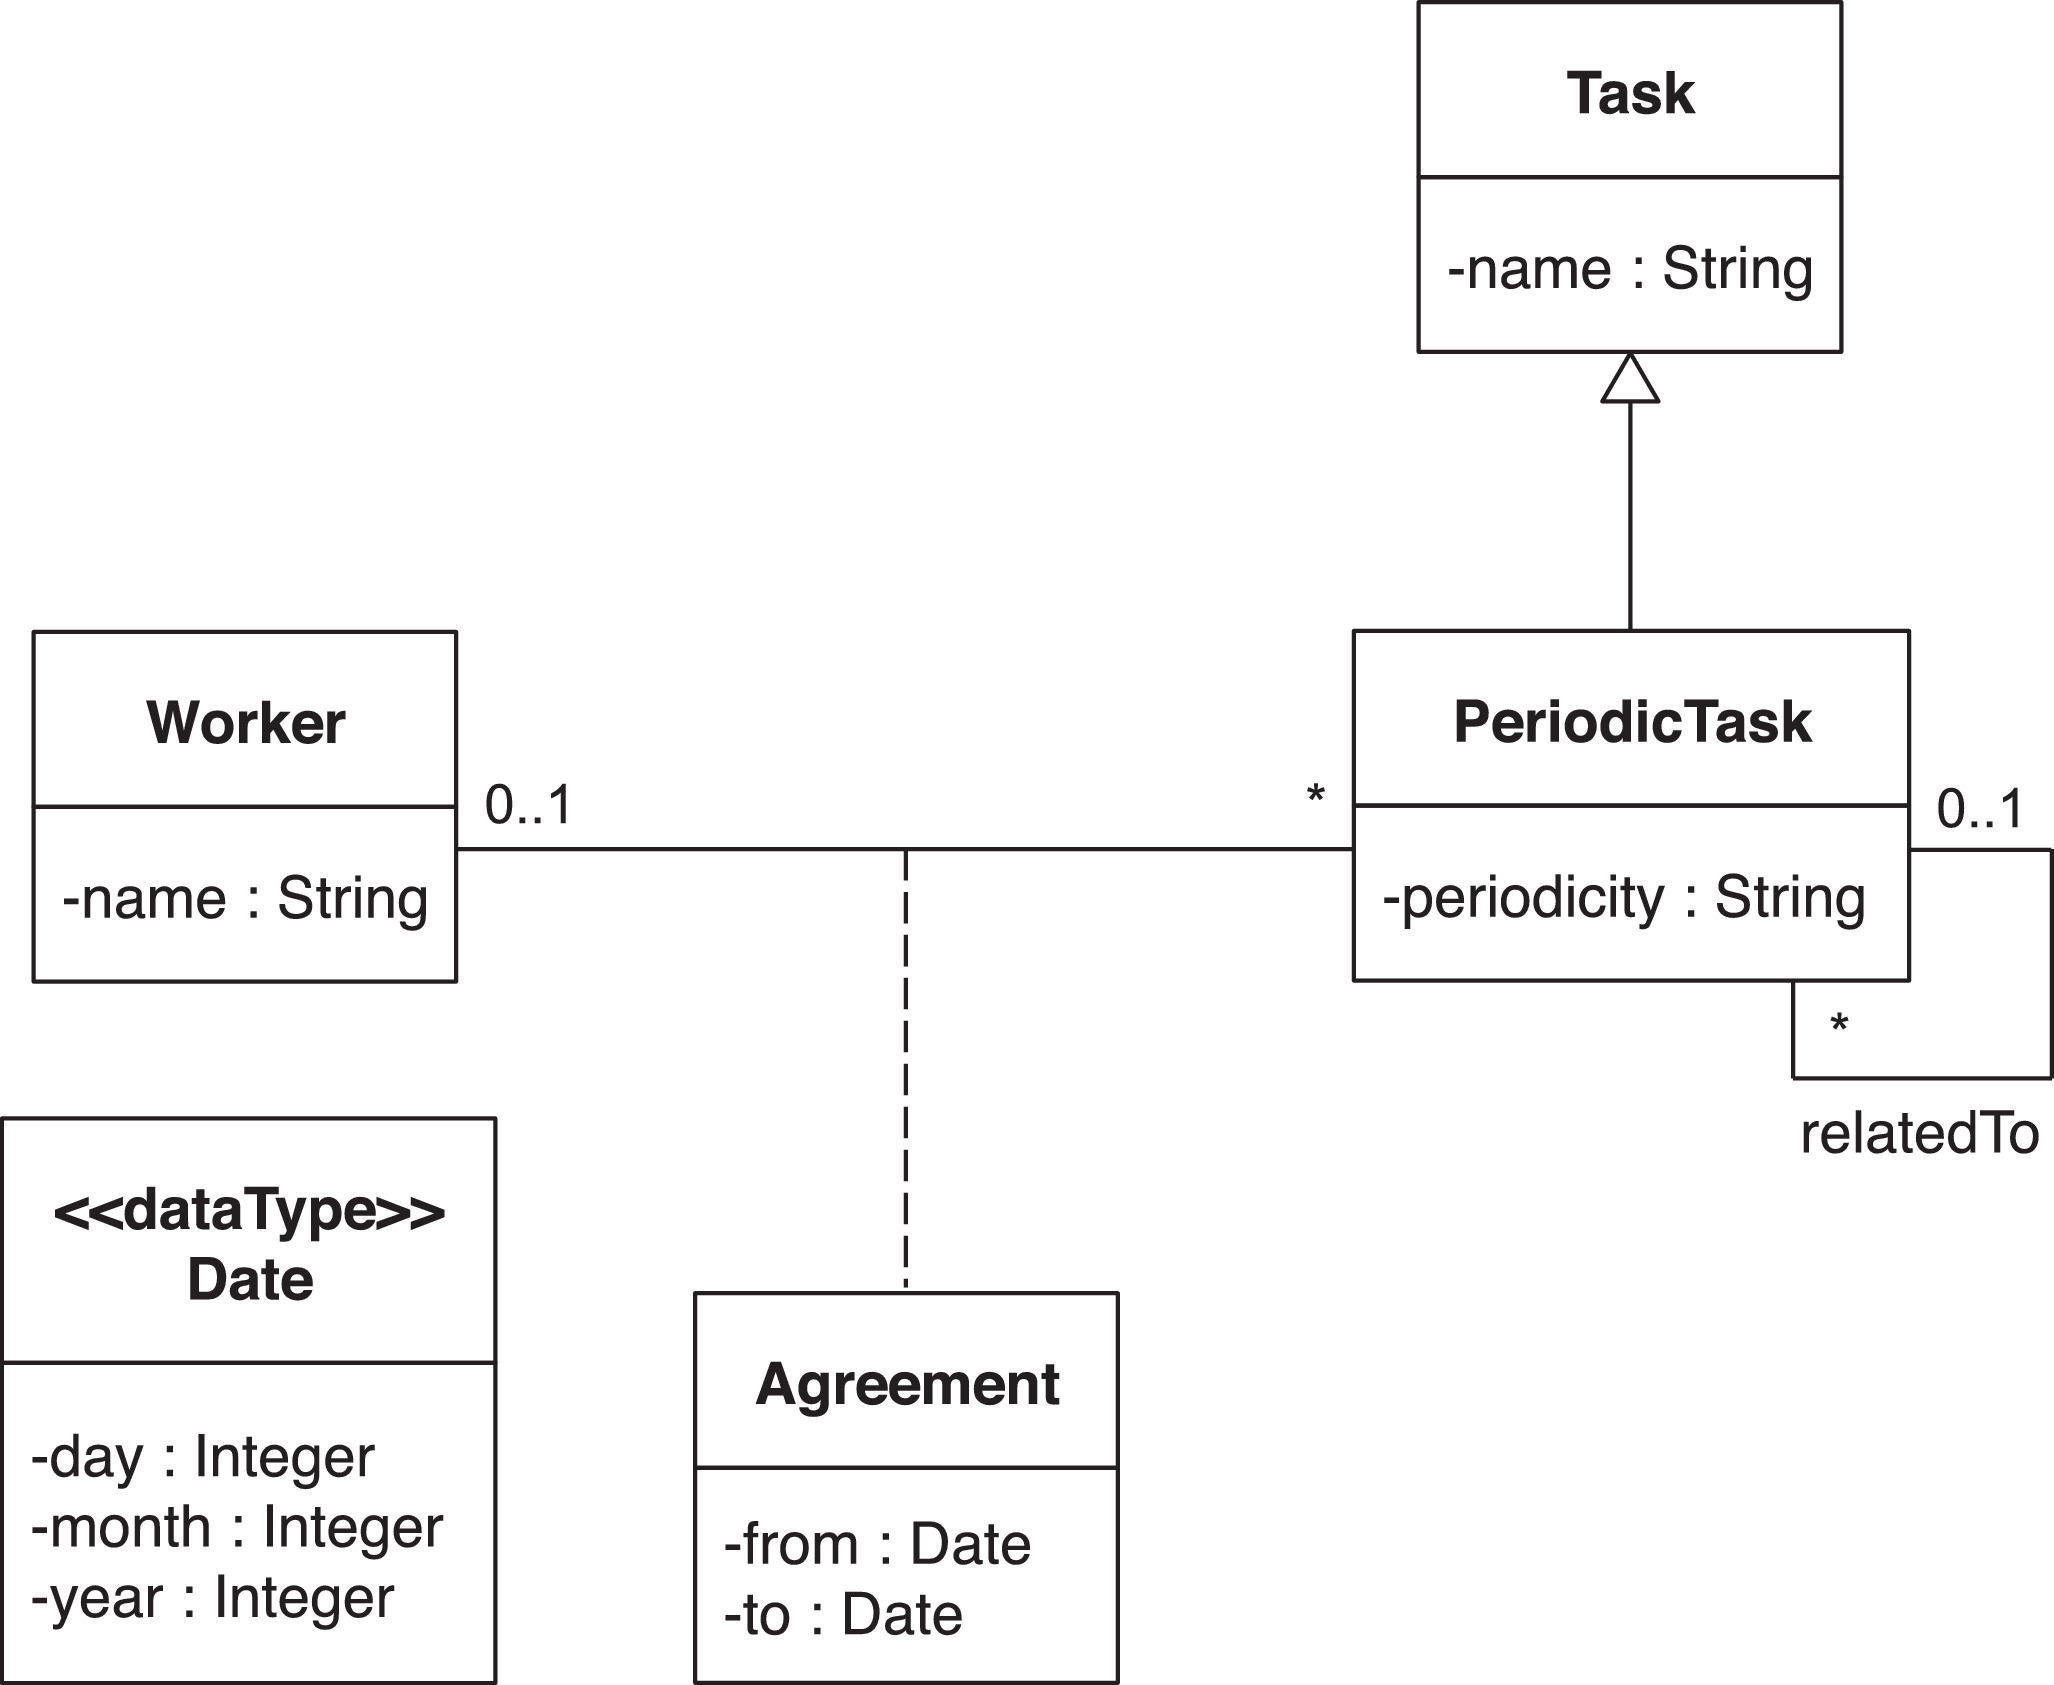
Example Class diagram used in the empirical evaluation
The design and the results of both studies are detailed in the paper. Here we only would like to outline the findings of both studies and several recommendations to improve the performance of UML modeling tools as well as the way of how UML modeling is taught in order to overcome the detected challenges.
See some conclusions on the usability of UML tools after analyzing over 10h of video recordings of students trying to draw a UML class diagram Click To TweetModeling Strategy
In terms of the modeling strategy, the most relevant finding from our empirical experiment is that there is no relevant difference in terms of the global modeling strategy (breadth, depth or alternately modeling).
This variable modeling strategy is in part due to the unrestricted approach followed by the modeling tools that let modelers draw diagrams as they please. And while this freedom is, in principle beneficial, it adds a new hurdle to novel modelers that would probably prefer a more systematic approach and guidance to model. As such, we recommend either teachers or (even better) tools to suggest a modeling strategy to novice modelers until they feel empowered enough to adapt the strategy to their own perspective on how to be most efficient at modeling.
A typical strategy to be used could be, for instance, using a top-down view (which directly derives from the breadth modeling strategy proposed in this work), which consists in:
- Identify and model the classes (which classes do we need?), then
- Identify and model associations (how are the classes connected?), and finally,
- Identify attributes and multiplicities (what do we want to know about the objects?). If enforced by the modeling tools, this functionality should be optional and be switched on/off by the modeler at will.
Even though we suggest recommending a specific modeling strategy, the results of our empirical experiment did not find significant differences in terms of effort (time and number of clicks) wrt the used strategy. In particular, the collected data reveals that the students who follow the depth modeling strategy took 9 minutes on average to model the whole class diagram, while the students who follow the breadth modeling strategy took 10 minutes and the students who follow an alternate strategy took 11 minutes. Similarly, regarding the number of clicks, the students who follow the depth modeling strategy took 127 clicks on average to model the whole class diagram, while the students who follow the breadth modeling strategy took 133 clicks and the students who follow an alternate strategy took 119 clicks.
In fact, the ideal modeling strategy, especially when it comes to the modeling of specific individual types of elements like attributes or associations, can also depend on the particular UI of the modeling tool. For instance, in MagicDraw a user can create an attribute directly introducing its name and type inside the class box (and obviate the rest of its properties unless it explicitly wants to indicate them by first opening the extended menu). Instead, in Papyrus each time a user creates an attribute, the extended menu is automatically opened at the bottom of the screen and all its properties are visualized. This could explain why only the users of the second group specified some properties such as the visibility and multiplicity of attributes.
Modeling Effort
From our empirical experiment, we observed that the effort (measured as time and number of clicks) devoted to building a class diagram is significantly different when using MagicDraw and Papyrus. This difference is related to the obstacles the participants found using both tools (slightly more in Papyrus), as we will discuss in RQ3. As a curiosity, 13% of the participants (considering both groups) did not finish the whole class diagram in 15 minutes. This is clearly a trade-off to convince software developers to use modeling tools.
Moreover, from our analytical experiment we conclude that, during the initialization tasks (creating a new project and an empty UML class diagram), MagicDraw is more usable in terms of efficiency (amount of steps and estimated time). For instance, on average, MagicDraw requires 9.5 steps and 6.15 seconds less than Papyrus to create a new project and 14.33 steps and 10.47 seconds less than Papyrus to create an empty class diagram. However, in the rest of the tasks devoted to the construction of the UML class diagram both MagicDraw and Papyrus present similar usability. In particular, MagicDraw is slightly more efficient when adding attributes and creating association classes while Papyrus is more efficient when creating UML classes and binary associations.
When taking into account both experiments, we conclude that globally the effort and efficiency could be improved in both tools. Many times modelers were not able to optimally use the tools and end up being much more inefficient than the optimal solution. For instance, when the tool offers several alternatives to achieve the same goal (e.g. creating an association class), modelers do not always choose the simplest path. A similar trade-off between freedom and efficiency as above. We encourage tools to rethink some of their UI components and be more opinionated with their interface in order to prevent clearly inefficient modeling strategies.
Do you think modeling sucks? I blame the tools Click To TweetModeling Obstacles
An exhaustive list of modeling obstacles modelers encountered during the experiment is detailed in the paper. Many of these obstacles are due to the inexperience of the modelers. For instance, in many of the recorded videos, we observed students having difficulties navigating the tools’ menus and options, forcing them to attempt the same task several times before finding the proper way to perform their goal. As explicitly evident in most of the videos, this generated a considerable feeling of frustration among them.
To overcome the modeling obstacles detected in our study (and indirectly decrease the modeling effort), we suggest several recommendations mainly oriented to improve the usability of modeling tools:
- First, and most important, modeling tools should fix their current known issues to increase the level of trustiness in them. For instance, in the Neon version of Papyrus, it is not possible to introduce the multiplicity of an association class created using the AssociationClass element in the palette.
- Modeling tools should include guidance for beginners to perform specific tasks. This guidance should be available under user request, for instance, as short embedded videos showing how to carry out specific tasks using the tool (such as creating association classes, etc.). Modeling wizards could also be created for this purpose.
- Modeling tools should provide useful tips not only when the tool is opened but when the tool detects the modeler really needs such tip. For instance, tools could detect when the modeler is in a loop trying to achieve a specific task and suggest useful and personalized tips to help her. AI techniques could be employed to detect such tool learning challenges and react accordingly.
Although most of the obstacles observed are directly related with the modeling tools, like the ones above, other obstacles are more linked to a general lack of modeling knowledge. To improve them, we would like to see some tweaks on how we teach modeling:
- Modeling instructors should explain that some elements in a class diagram should be created following a specific order, even if it is just for pragmatic reasons.
- Instructors should also emphasize the use of the best practices in conceptual modeling.
- And they should recommend the use of proper names to facilitate the understandability of the class diagrams, for instance making use of the naming guides.
To sum up, our experiments report that there are no notable differences regarding the usability of MagicDraw and Papyrus. But only because both showed important shortcomings that could be improved to provide a significantly better modeling experience.
I’m a lecturer at the Open University of Catalonia (UOC) and a researcher at SOM Research Lab (IN3-UOC). My research interests are mainly focused on model analysis under the Model-Driven Engineering (MDE) perspective.


That’s a very interesting study and article, thank you. I believe the work on improving modelling tool usability is *VERY* necessary.
It appears that your current study is primarily focussed on beginner modellers (undergrads) who are given a class diagram that they try to recreate using a tool. This raises several questions in my opinion:
1. How would you estimate the burden of tool complexity in comparison to the general difficulty of learning UML in general? Evidently a helpful tool will increase modelling fun, but when students have to invest weeks into learning UML anyway, the few extra hours to become familiar with an expert tool seems like a minimal extra. (speaking as the devil’s advocate…)
2. What’s your suggestion for the different tool requirements of beginners, who should not be overwhelmed by too many buttons and expert modellers, who prefer not to be slowed down by functions hidden in menus and dialogues. Should there be a “beginners mode” and a different “expert UI view”?
3. Are you planning on doing a systematic analysis of such tasks also for expert modellers? (i.e. what would make their life easier and where do they lose most time?).
Thank you very much for your comment.
Regarding your questions:
1) Most likely, the time needed to learn the syntax and the semantics of UML is greater than the time to learn a UML modelling tool. However, if tools were more usable they could also serve for the first purpose, so syntax, semantics and tool use could be learned at the same time following the “learn by doing” methodology.
2) We suggest that modeling tools should include a guidance for beginners to perform specific tasks. This guidance should be available under user request, for instance, as short embedded videos showing how to carry out specific tasks using the tool (such as creating association classes, etc.). Modeling wizards could also be created for this purpose. Modeling tools should also provide useful tips not only when the tool is opened but when the tool detects the modeler really needs such tip. For instance, tools could detect when the modeler is in a loop trying to achieve a specific task and suggest useful and personalized tips to help her. AI techniques could be employed to detect such tool learning challenges and react accordingly.
3) This is a really interesting way to extend this work. Unfortunately, obtaining real data from expert modellers is more difficult than experiment with our own students. In any case, you are welcome to participate!
This is an interesting initiative, but I apologize to have a slightly different focus. To me the time to build a model is hardly measured in seconds. I teach software modeling for years now and even I sometimes have to think about the best way of linking classes or interfaces etc. Building a model requires thinking about the domain and the elements of the model.
What I find interesting is the amount of code that students can generate out of the model, and I hope that more efforts will go into this direction. I read that one could use Papyrus to generate code using ALf but setting up the environment to do so, is not easy. I enjoyed very much a few lessons on executable UML but could not find the environment that the author has used to this purpose. This group, I humbly suggest, should fix a more practical target, i.e., having a tool that students can easily set up and use for modeling purposes using any model driven development (MDD) tool. This will enormously help students build better models and spread the ideas of MDD to a large audience of practitioners.
Again, I apologize to get a little out of the focus of discussion but wanted to express my 2 cents of opinion.
Thanks for this important initiative
I agree that building a model requires thinking about the domain but this experiment was not really building a model but about “replicating” a given model (i.e. a class diagram that we had already created for them before) in a modeling tool. In this sense, the goal of the experiment was really the usability test of the tool and not the abstract modeling capabilities of the students.
It’s 25 years I’m in software industries, except in specific industries, for business projects, though it is officially still in big corps methodologies – because in these departments where I’ve also been, they recruit some kind of consultants who for most unlike me have never managed a real world big IT project – business analysts and developers don’t use UML anymore. When on projects, I asked developers to document with UML with any tool they want (even the easiest one like yUML), they still shy away 🙂 So now I’m thinking about using another kind of diagram which is grafcet – normally used in automation – and after thinking several months on it I’m now pretty sure I can substitute UML diagrams with it for both sides of the fence: business user and developers. I’ll even work to map and generate UML in the future 😉 There’s no software at the moment, I’m working on a UI Kit first https://grafcet.online