

Nowadays, the amount of open data sources is increasing exponentially from both the public and private sectors (that’s why we need an open data for all initiative!). These data are commonly available from different end-point services that can be queried following the standards of the technology used to create the service. Despite the great potential of open data, and the valuable information that its usage can report to improve the data itself, currently most of the data providers are unaware of how their data is used by end-users.
In our paper Model-Driven Analytics for Open Data APIs, written by Elena Planas and David Bañeres, and presented at WEOD’18 (International Workshop on Engineering Open Data), we present a Model-Driven Analytical tool for Open Data APIs. Our tool is able to visualize how end-users interact with open data sources regarding two types of metrics: (1) performance metrics, focused on general usage parameters like response time; and (2) semantic metrics, focused to analyze contextualized data. The tool is described and a case study is presented based on a model manually composed from two Open Data APIs. The monitoring of the open data consumption reports highly valuable information to data owners, guaranteeing the return-on-investment.
This paper is included into the ICWE’18 (18th International Conference on Web Engineering) Springer LNCS proceedings. Keep reading for a summary or get the full paper online on the publisher site (in press) (free pdf version here). You can also take a look at the presentation:
Contents
1 Introduction to Open Data Analytics
More and more data is becoming available online every day coming from both the public sector and private sources. Government, cities, and private industry are producing a massive amount of data that can be publicly accessed. As an example, the European data portal registers more than 800,000 public datasets online until April 2018. Web APIs (Application Programming Interface), which wrap the data sources and expose a set of methods to access them, are becoming the most popular way to access open data sources. For example, in April 2018, Programmable-Web lists more than 19,415 public APIs. REST is the predominant architectural style for building Web APIs. REST is growing especially in the private sector since APIs offer, among other benefits, a fine-grained control on the access requests over the data. Also, REST Web APIs are a specific kind of web services that adhere to the Representational State Transfer architectural style and rely on the HTTP protocol for communication.
The open data movement, through the use of open data sources, aims to empower end-users to exploit and benefit from these data. However, despite the great potential of open data sources, and the valuable information that its consumption can report to improve the data itself, nowadays most of the data providers are unaware about how their data is used by end-users. An example is the open government data [5] which, without data usage analysis, a government will be unable to prioritize which data is relevant for citizens or even curate the available one. In other words, only when data providers get feedback regarding how their data is consumed, the use of open data can provide a guaranteed return-on-investment. Therefore, there is an increasing demand to analyze how and which data are consumed. As reported in [6], collected usage statistics are considered to be valued feedback to data owners, since they give a notion of the relevance and enable segmentation. Servers are capable to generate and analyze logs based on traffic but they lack the capacity to diagnose the data based on a known model that is commonly accessed.
This paper focuses on the design of a Model-Driven Analytical tool for Open Data APIs. Our tool is able to visualize how end-users interact with open data sources regarding several metrics. Similarly to [1], our approach follows the Model-Driven Analytics paradigm, which pursues the idea of Model-Driven Engineering [2] to the domain of data analytics. Model-Driven Analytics defines a transparent and continuous process of decomposing knowledge into various analytic elements which can help to decompose the complexity of understanding as a composition of various analytical tools [4].
The monitoring of the open data consumption using tools similar to the one we propose can report highly valuable information to data providers. For instance, to improve data (e.g. updating outdated data, improving data precision, avoiding overlapping, removing non-accessed data,. . . ) and to infer new useful knowledge (e.g. detect new content they should publish, identify potential partnerships based on data typically queried,. . . ), among many others.
The remainder of this paper is structured as follows. Section 2 introduces the running example used along the paper. Section 3 describes the metrics used in our tool and Section 4 presents the overall approach we propose to visualize the results. Finally, Section 5 concludes the paper.
2 Case Study: Battuta and RestCountries Web APIs
In this paper we use a case study based on two RESTful Web APIs: (1) Battuta, which provides world-wide location (country/region/city) service; and RestCountries, which provides information about countries and languages.
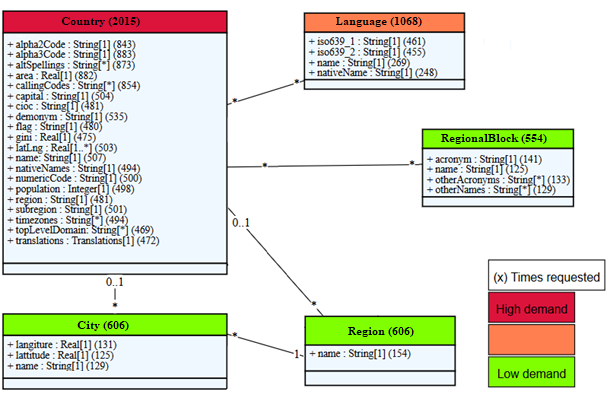
Figure 1. Global UML model from Battuta and RestCountris Web APIs annotated with two semantic metrics (heat UML model and entity/field consumption).
Figure 1 provides the global UML model representing the data managed by Battuta and RestCountries Web APIs. This model has been obtained from a previous semi-automatic process. First, the individual model of each API has been automatically generated based on a discovery process that generates model-based OpenAPI specifications for REST Web APIs by using API call examples using the OpenAPItoUML tool [3]. Then, both individual models have been manually merged.
A custom intermediate service has been implemented to perform general requests to the global model and automatically generate sub-requests to the different API end-points to resolve the general request. This custom service will help to gather log data to show the potential of the developed Model-Driven Analytical tool.
3 Usage metrics
In order to monitor the consumption of open data sources, we have defined two types of metrics: performance metrics and semantic metrics.
Performance metrics measure and report mostly performance and volumes of manipulated APIs. These types of metrics are similar to the metrics used for web server analytical tools. Currently, we have defined and implemented the following performance metrics:
- Average response time by API: The tool analyses individually the response time by API end-point.
- Average response time by request/sub-requests: Similarly, the tool is capable to offer more fine-grained information for each individual request and their generated sub-requests.
- Average number of accessed APIs and generated sub-requests for each request: These first three metrics may help to evaluate the complexity of the general request.
- API reliability: This metric stands for knowing the reliability of the APIs by collecting the response codes of each sub-request.
- Query history (with date-range): All previous information could be analyzed by any date range (specific date, relative to a date, real-time, among others). Filtering data may help to evaluate data consumption over time.
On the other hand, the aim of the semantic metrics is to show the ratio of consumed data within the global model. Based on the model that represents the relationship among data stored in one API or several APIs, semantic metrics help to analyze which entities (UML classes) and fields (UML attributes) are mostly demanded. We have defined and implemented the following metrics:
- Heat UML Model: This metric transforms the model to a heat map where entities consumption is highlighted using different colors. This metric will be useful to evaluate which data is mostly accessed.
- Entity/field consumption: Additionally, the number of requests to a specific entity or field is quantitatively shown in the model by general requests and sub-requests. This metric is a fine-grained view of previous metric by showing which fields are really used.
- Query diagram: The Open Data protocol allows to merge in a single request information of different entities. This metric focuses on showing the navigability to resolve the performed query. For instance, in our model, the query from Spanish-talking countries get all the cities in OData protocol is “/Countries(”ES”)/Cities”. Thus the query diagram will show a navigability from the entity Countries to Cities in this specific query.
4 Model-Driven Analytics
In this section, the Model-Driven Analytics process and the corresponding tool are described (see Figure 2).
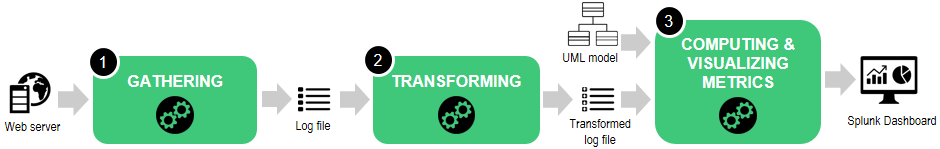
Figure 2. Overview of the Model-Driven Analytics process.
The global process is performed in three steps:
Step 1: Log gathering process
The goal of the log gathering process is to record all requests to the different API end-points. Every time a request is performed, a new entry is added to the log. Note that, the gathering process can be done automatically within the web server by using any logger package. In this paper, the logger package log4j has been used into the intermediate service described in Section 2.
We have defined an specific log format to be able to record requests and sub-requests. Each log entry is composed by: (1) the initial line, which contains the initial timestamp and the URL of the request; (2) as many lines as the number of sub-queries the request needs to be resolved, with specific information of each sub-query; and (3) the final line, which contains the final timestamp, the URL request again and information about the reliability of the query.
Step 2: Transformation process
A subset of the metrics described in Section 3 cannot be computed directly from the log information. Thus, a preprocessing is needed. The gathered log file generated in the previous step is transformed using an ETL (Extract, Transform, Load) process and stored in another log file.
Step 3: Computing metrics & visualization process
The last step of the process is to compute the presented usage metrics and visualize them. This step takes as input: (1) the transformed log file, with information about all the requests performed; and (2) the global UML model that represents the structure of the information contained in the queried APIs.

Figure 3. Screenshot of the Dashboard visualizing a subset of metrics.
In order to compute and visualize the assembled information, we use the tool Splunk. Splunk is a software for analyzing and visualizing machine-generated data via a web-style interface. Splunk has a friendly user interface to create queries from log files. Additionally, custom dashboards can be created in web format. Using Splunk capabilities, we have designed a custom and interactive web dashboard to show the metrics described in Section 3. The dashboard has been implemented with HTML, JavaScript, formatted with Bootstrap (HTML5) and JointJS to visualize the UML model.
Figure 1 shows a screenshot of part of the implemented Dashboard visualizing the heat UML model and the entity/field consumption metrics. Figure 3 shows other metrics based on random requests performed to the model on the entity Countries. Here, the metrics average response time, APIs reliability and query diagram from performed requests are shown.
5 Conclusions and Future Work
In this paper, we have presented a Model-Driven Analytics process, and the corresponding tool, to monitor and visualize the consumption of open data sources through the use of Web APIs. Our tool allows visualizing the consumption of several Web APIs in a unified view regarding several performance and semantic metrics defined in the context of this paper.
As a further work we are interested to facilitate the definition of metrics and the creation of customized dashboards by the end-users through the use of DSLs. Additionally, we will continue studying how Model-Driven Analytics can be adapted based on user preferences and satisfiability and how this information can be used to improve and curate the current data accessible from Web APIs.
References
[1] C. Bernaschina, M. Brambilla, A. Mauri, and E. Umuhoza. A Big Data Analysis Framework for Model-Based Web User Behavior Analytics. In International Conference on Web Engineering, pages 98–114, 2017.
[2] M. Brambilla, J. Cabot, and M. Wimmer. Model-Driven Software Engineering in Practice. Synthesis Lectures on Software Engineering. Morgan & Claypool, 2017.
[3] H. Ed-Douibi, J. L. C. Izquierdo, and J. Cabot. OpenAPItoUML: A Tool to Generate UML Models from OpenAPI Definitions. In International Conference on Web Engineering (on press), 2018.
[4] T. Hartmann, A. Moawad, F. Fouquet, G. Nain, J. Klein, Y. L. Traon, and J. Jézéquel. Model-Driven Analytics: Connecting data, domain knowledge, and learning. CoRR, abs/1704.01320, 2017.
[5] A. Holzinger and I. Jurisica. Knowledge discovery and data mining in biomedical informatics: The future is in integrative, interactive machine learning solutions. In Interactive knowledge discovery and data mining in biomedical informatics. 2014.
[6] M. Vander Sande, M. Portier, E. Mannens, and R. Van de Walle. Challenges for Open Data Usage: Open Derivatives and Licensing. In Workshop on Using Open Data, 2012.
I’m a lecturer at the Open University of Catalonia (UOC) and a researcher at SOM Research Lab (IN3-UOC). My research interests are mainly focused on model analysis under the Model-Driven Engineering (MDE) perspective.


Recent Comments