

Smart cities target the achievement of sustainable economic, societal, and environmental development while enhancing the quality of living for their citizens. In this context, smart decision-making aims to support smart cities stakeholders in understanding and effectively managing a smart city with its complex nature characterized by different dimensions (e.g., mobility, education, environment), each managed by different stakeholders (e.g., public administrations, private institutions) not always communicating with each other. This makes it difficult for public administrations to have a complete overview of the city.
Smart Governance aims to make use of Key Performance Indicators (KPIs) (i.e., raw set of values providing information about relevant measures) in processing information and decision making enabling open, transparent and participatory governments, by supporting the knowledge sharing among the involved actors.
| KPIs are gaining relevance at European level. Indeed, the European Commission published an agenda containing the Sustainable Development Goals (SDGs) to be achieved in 2030 to promote a smart, sustainable, and inclusive growth of European cities. |
Nevertheless, when investigating the literature, surprisingly we did not find any comprehensive framework supporting an automatic and flexible assessment of KPIs for smart cities, further providing intuitive representation and visualization of assessed KPIs (also for non-experts) applicable to any kind of smart cities, from small to metropolitan ones.
KPIs Assessment for Smart Cities
KPIs assessment supports smart governance managers in continuously evaluating smart cities by measuring their sustainability and smartness, thus significantly affecting the smart city decision making processes.
“A KPI is then designed to help users quickly evaluate the current value and status of a metric against a defined target” is what Microsoft research reports online.
Specifically, KPIs are elicited and defined by standardization bodies, such as the International Telecommunication Union (ITU), along with their collection methodology, standard definitions and formulae. An example is reported in Fig. 1.
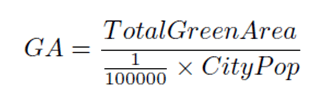
Figure 1. An example of a KPI (i.e., Green Areas) formula.
The selection of KPIs must be driven by the subject smart city and its peculiarities, notwithstanding that KPIs definitions and formulae constantly adhere to those provided by the standardization bodies.
Analyzing different smart city projects dealing with the performance evaluation of smart cities we noticed that they can be grouped into three main categories, based on the type of implementation strategy and/or target platform they exploit, namely:
- Manual approaches, where essentially the KPIs definition, data collection and KPIs measurement is manually performed;
- Spreadsheets-based approaches mainly rely on the use of Excel spreadsheets and the Power Pivot In these approaches, an external data source (e.g., a MS SQL database) is configured to host the required data. This data is then given as input to the KPIs formulae defined in Excel, which will actualize the values and present the results.
- Web-based platforms (e.g., here) for those approaches supported by an online platform exposing defined KPIs whose calculation is offered as a platform.
However, each of these categories shows some drawbacks and limitations. In fact, even though existing approaches are tool-supported, they do not provide automation and, at the same time, other relevant features required to have uniform but customizable models. For instance, many spreadsheets-based approaches benefit from a good level of openness allowing the customization of KPIs formulae (e.g., w.r.t. different cities), but they show consistent usability issues. On the other hand, web-based platforms are typically proprietary, thus if customization is provided, it relies on a pay-per-use license.
Due to these challenges and limitations, we propose the MIKADO framework for the automatic KPIs assessment that is based on the uniform modeling of both smart cities and the KPIs selected to evaluate them. The approach supports the KPIs customization to different cities and requirements and the KPIs evolution over time, by exploiting Model-Driven Engineering (MDE) techniques. It is inspired by software quality assessment practices and it basically enables a round-trip process (see Fig. 4) for the performance analysis of smart cities and the interpretation of the results, assisting smart cities administrators to perform the decision-making process.
The choice of the name MIKADO relates to the famous game in which it is the name for the most valuable stick. The connection with our approach lies in the fact that it can help to get the most value out of a bunch of “data sticks”.
MIKADO at a Glance
Our model-based framework is composed of different modeling artifacts:
- a Smart City Metamodel,
- a KPIs Metamodel,
- an evaluation engine for calculating the KPIs,
- a code generation process that transforms models in graphical views (as shown in Fig. 5).
Fig. 2 summarizes the proposed KPIs evaluation approach, which consists of four main phases having dedicated input and output elements.
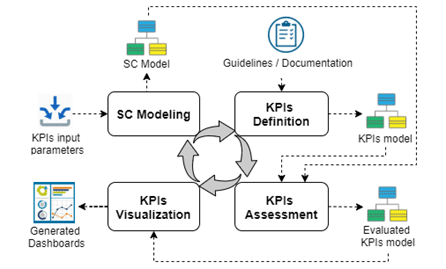
Figure 2. KPIs assessment process overview.
The assessment of a smart city starts from the SC Modeling phase, during which the user designs a model representing the city under evaluation. In the SC Model (see the graphical representation in Fig. 3 created with our modeling editor), the smart cities are designed in terms of stakeholders, infrastructures, data sources and data types (e.g., IoT infrastructures, open data sources). In this way, the SC Model covers the input parameters needed to calculate the KPIs of interest.
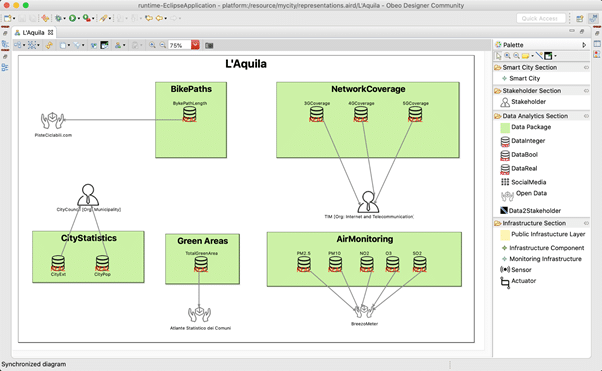
Figure 3. Graphical representation of the smart city of L’Aquila (Italy).
In the KPIs Definition phase, following KPIs Documentations/Guidelines, the user models or selects the relevant indicators for the smart city under evaluation. In the KPIs Model given as output, the calculations of the selected KPIs are defined by using a textual Domain-Specific Language (DSL), as shown in Fig. 4.
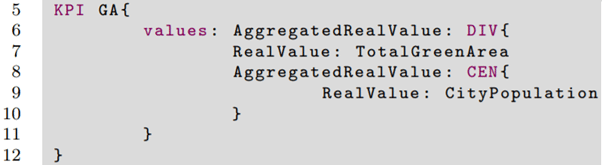
Figure 4. Textual concrete syntax for the definition of the KPI Green Areas (GA).
The outputs of the described two phases are in the form of models, which are the inputs for an evaluation engine that makes the KPIs assessment over the candidate smart city possible. The output of this phase is an Instantiated KPIs Model with the results of the assessment that, in turn, is the input of the KPIs Visualization phase during which Dashboards, representing the KPIs assessment with diagrams, are generated through model-to-text transformations as shown in Fig. 5.
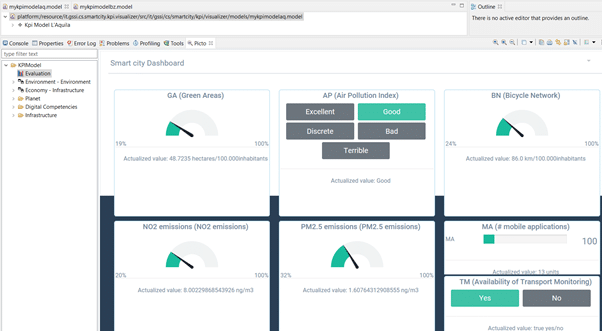
Figure 5. Generated graphical Dashboard reporting the KPIs assessment for the city of L’Aquila (Italy).
Hints of evaluation results
To evaluate MIKADO and verify not only its performances but also the level of appreciation by possible users, we performed different experiments. Specifically, we evaluated two main aspects of our approach:
- the scalability of the evaluation engine in managing smart cities and KPIs models of increasing size, pointing out the efficiency in terms of the evaluation engine’s execution time and a promising scalability results since the system took approximately 5 seconds for assessing 800 KPIs over 10 smart cities;
- the usability and understandability w.r.t. spreadsheet-based approaches, through a survey with smart cities experts showing that our DSL is perceived as more comprehensible, particularly when considering KPIs with more complex calculations.
As the current approach already showed promising evaluation results, we plan to extend it with new features like smart cities comparison, simulations and KPIs interrelations and historical smart cities models. Lastly, we are currently working on an extension of our framework enabling KPIs continuous monitoring in a Digital Twins perspective.
Refer to the paper, for the full specification of the framework and details about all the mentioned modeling artifacts making it. This post has been co-authored by Maria Teresa Rossi and Martina de Sanctis and revised by Ludovico Lovino and Manuel Wimmer.
A video demonstration of the tool is also available. Enjoy it!


Recent Comments