

Since the early days of Model-driven Engineering (MDE), our community has been discussing the reasons why MDE had not quickly became mainstream. It is now clear the answer is a mix of technical and social factors, but among the former, the lack of maturity of MDE tools is often mentioned.
We have explored the question of whether this lack of maturity is actually true. We do so by comparing the maturity of over a hundred modeling and non-modeling projects living together in the Eclipse ecosystem. In both cases, we use the word project to refer to a variety of tools, libraries and other artefacts to build and manipulate software components, either at the model or code level. Our maturity model is based on code-centric and community metrics that we evaluate on the repository data for both kinds of projects. Their incubation status is also considered in the assessment.
See the results of comparing the maturity of over a hundred Eclipse tools Click To TweetResults show that there are indeed differences between modeling and non-modeling projects, though less than we expected when setting up the study. Moreover, while the incubation status clearly separates non-modeling projects, the same is not true for modeling projects which seem to remain much more stable across their lifespan. We believe our results help to have a better perspective on maturity of modeling support nowadays and provide ideas for further analysis towards their improvement
This work has been accepted at MODELS’17 conference, to be presented in September. Read below for the full details of the study. You can also download the pdf or go over the slides.
Contents
1 Introduction
Model-driven Engineering (MDE) refers to a software development methodology where software abstractions –or models– are systematically used along the process [1]. MDE promises many potential benefits (e.g., gains in productivity, portability, maintainability or interoperability) and several studies have been conducted to support these claims with empirical data [2-6]. Moreover, in the last years, the technological ecosystem around MDE has flourished, providing developers with a plethora of tools to support modeling tasks, ranging from model management solutions to model transformation and code-generation engines. A large number of these tools are somehow linked to the Eclipse platform. For instance, many tools are built on top of the Eclipse Modeling Framework (EMF) or depend on other popular Eclipse modeling projects like ATL.
Nevertheless, adoption of MDE is still far from being the norm [7][8]. A combination of technical and social factors are typically enumerated as possible reasons for this, being the maturity of existing MDE tools one of them [8, 9]. While several works have studied how to measure the level of adoption of MDD in organizations [3, 4, 10, 11], to the best of our knowledge, none of them has paid special attention of how mature are modeling tools.
In this paper we conduct an empirical study of the maturity of modeling projects in the Eclipse ecosystem. We use the term “project” instead of “tool” to follow the Eclipse terminology. Still, both can be used mostly indistinctly, with the concept of Eclipse project covering not only tools in the strict sense of the word but also libraries and other similar artefacts used as part of tools. Their maturity level is then compared to that of the non-modeling ones in the same Eclipse ecosystem to minimize external variables that could affect the results of the analysis. To do so, we have defined a maturity model to assess the maturity level of Eclipse projects by relying on the data stored in their Git repositories. We have applied the metrics in this maturity model to the over one hundred official Eclipse projects, aggregating the results based on the modeling/non-modeling dimension but also on the project status (incubation/non-incubation, according to the Eclipse terminology).
The rest of the post is structured as follows. Section II describes the model we used to assess the maturity level. Section III presents the research method we followed in our study, including the research questions, the construction of the dataset and the metrics. Section IV reports on the main results. Section V discusses some extensions to our approach. Section VI refers to the replicability package. Section VII presents the main threads to validity. Section VIII reports on the related work. Section IX concludes the paper and presents some future work.
2 Maturity Model
2.1 State of the Art
Existing approaches to measure the maturity of software systems mainly rely on well-known standards such as ISO-25000 [12] or ISO-9126 [13]. However, these standards are focused on the measurement of software development processes and little attention is paid to assess the maturity of software tools. In this group of approaches we can also include other models proposed by OPM3, CMMI or PRINCE.
The Technology Readiness Level (TRL) [14] is a type of measurement system used to assess the maturity level of a particular technology. A project is evaluated against the metrics for each technology level and is then assigned a TRL rating in a 1 to 9 scale. Although it is more technology-centric, its application is based on set of dimensions that have to be measured in specific phases of the software development process of the product. No concrete metrics are proposed.
In the context of the Eclipse platform, the PolarSys working group defined a maturity model for Eclipse projects [15]. The model follows the Basili’s Goal-Question-Metric approach [16] therefore specifying a set of quality attributes, which are the goals for the measurement; concepts, which are mapped to questions; and metrics, which are the base measures, i.e., the actual metrics to calculate in the code. The approach was implemented and initially applied to 10 PolarSys (and closely related) projects. Other works have proposed some solutions to measure specific maturity dimensions in software systems but do not provide a full-fledged model for maturity. For instance, these works include the well-known metric in complexity from McCabe [17] or the proposal to measure the changeability of software systems proposed by Ayalew et al. [18].
2.2 Our Maturity Model
To measure the maturity level of Eclipse projects, we believe it makes sense to start from the PolarSys maturity model since it is the most concrete and already used and known within the Eclipse community. We have aligned it to the context of our study where only the Git repositories of the projects are used as input for the analysis. In particular, we have removed some metrics from the original model that require additional input sources and complemented it with new community metrics that can be derived from the analysis of the interactions at the Git level. In Section V, we comment on possible enhancements to this core maturity model.
In the following we present the main metrics of the model organized according to the involved dimensions, while Table I presents these metrics in the GQM framework style, thus linking them with the attributes and questions of the model. The last column of Table I (see Inf.) indicates how each metric influences the maturity level. Thus, the symbol ↗ means that there is a direct relationship between the metric and the maturity level (i.e., the higher the metric the more mature), while the symbol ↘ means an inverse relationship.
Table 1: Maturity model defined in our study.
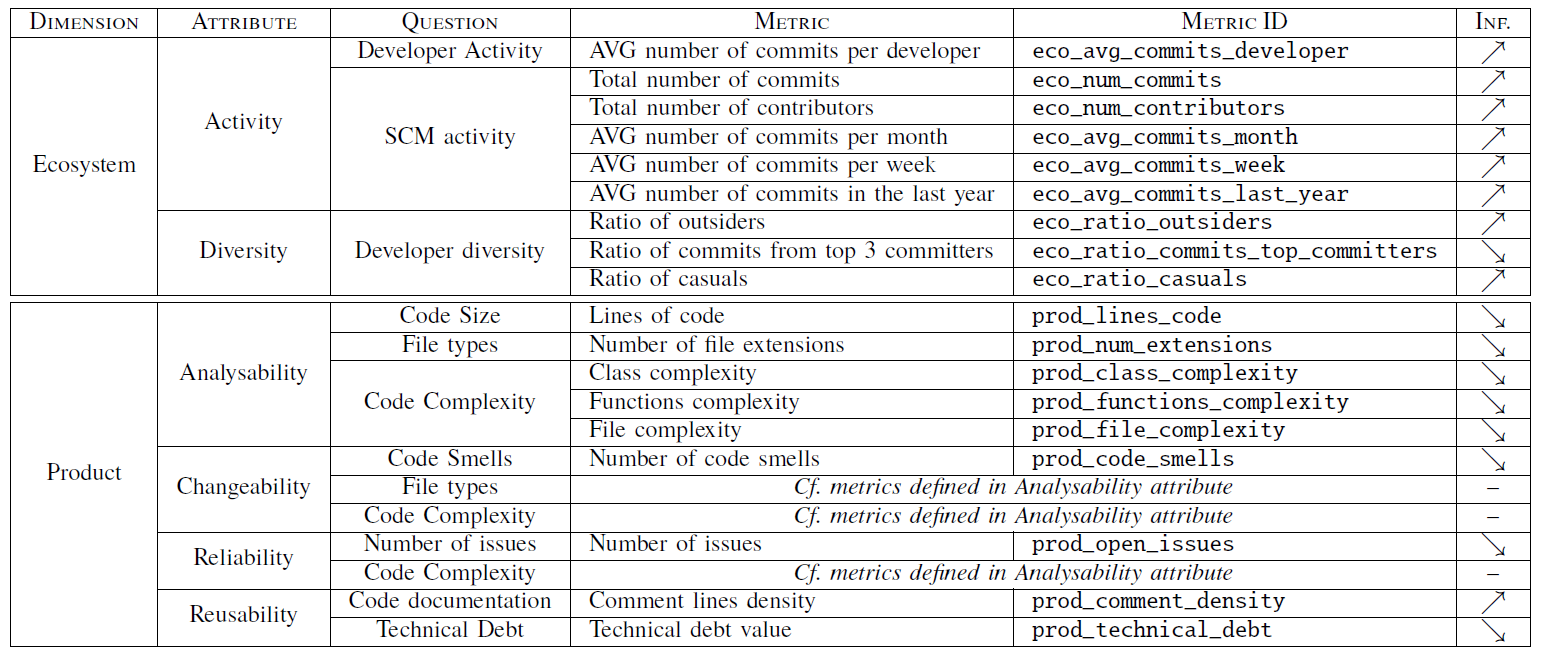
Ecosystem. A software ecosystem is defined as a collection of software projects which are developed and co-evolve together in the same environment [19]. This dimension targets the measurement of the sustainability of the ecosystem evolving around the repositories of a project. It addresses two attributes:
- Activity, which measures the development activity of the project’s ecosystem and considers two main questions, namely: (1) developer activity and (2) Software Configuration Management (SCM) activity. The metrics defined for this attribute includes the number of commits and contributors in the project, and the average number of commits per developer, month, week and in the last year (aggregated for all the repositories of a project).
- Diversity, which measures the diversity of the developers of the project. A rich range of contributors may improve the project’s sustainability and its adaptability to different situations. Furthermore, having developers and users with different contexts and perspectives on the project helps widening its scope and provide a more generic support.
To measure this attribute we define two new classes of developers which allow us to better characterize the community [20, 21], namely: outsider and casual. An outsider is a developer that has contributed to the project but cannot modify the project’s codebase. Outsiders can be identified by analyzing the commit information of the Git repository. Commit metadata specifies both the author of the commit (i.e., the actual developer contributing the code) and the committer (i.e., the developer able to incorporate the modifications into the project’s codebase). Outsiders are therefore those developers that have authored a commit but are not part of the project’s committers. On the other hand, casuals are developers that have contributed a number of commits less than the 5% of the total number of project’s commits.
The metrics defined for this attribute include the ratio of outsiders and casual developers, and the ratio of commits from the top 3 committers of the project (note that there is no overlapping among the classes of developers)
Product. This dimension measures some quality aspects of the product delivered by the project. It addresses four attributes:
- Analysability, which measures the degree of effectiveness and efficiency with which it is possible to assess the impact of a change on the product and considers three main questions, namely: (1) code size, (2) file types and (3) code complexity. The metrics defined for this attribute include the lines of code, the number of file extensions and the class, functions and file complexity.
- Changeability, which measures the degree to which a product or system can be modified without introducing defects or degrading its quality. A project with a good changeability is easy to maintain and will attract more developers. This attribute considers three main questions: (1) code smells, file types and code complexity. Some of these questions match with those ones identified for the analysability attribute, and therefore the same metrics are applied. Only the metric calculating the number of code smells is new in this attribute. This metric refers to a surface indication that usually corresponds to a deeper problem in the system.
- Reliability, which measures the degree to which the product performs specified functions under specified conditions for a specified period of time and is perhaps one of the first quality attribute end-users will notice. The questions considered by this attribute are (1) number of issues and (2) code complexity. The new metric introduced in this attribute assesses the number of issues, which can be detected by analyzing the commit messages.
- Reusability, which measures the degree to which an asset can be used in more than one system, or in building other assets and considers two questions, namely: (1) code documentation and (2) technical debt. The metrics defined for this attribute include the comment lines density and the technical debt value. The latter is generally used as a metaphor referring to immature software artifacts that do not satisfy the required level of quality [22].
3 Research Method
In this section we discuss how our study has been set up. We first present our research questions. We then describe how we built the dataset for our study (Section III-B) and how we computed the required metrics (Section III-C) to answer those questions. We finalize the section showing some descriptive statistics for the constructed dataset (Section III-D).
3.1 Research Questions
Our objective is to grasp a better understanding of the maturity of modeling projects in the Eclipse ecosystem. More specifically, we identify three main research questions:
RQ1 Are modeling projects as mature as non-modeling projects? Our hypothesis is that the maturity of Eclipse modeling projects differs from non-modeling ones.
RQ2 Is the incubation status of a project an important factor when comparing modeling and non-modeling projects? This question specializes the previous one by considering the incubation status of projects.
RQ3 Is the incubation status a valid indicator of the maturity of a modeling project? We hypothesize that projects out of the incubation phase should show significant improvements with regard to the still-in-incubation ones.
3.2 Building the Dataset
We built a dataset originally comprising all Eclipse projects and their corresponding repositories (a project may involve several repositories). The construction of the dataset involved four phases: (1) web scraping, (2) filtering, (3) cloning and (3) importation. The first phase collected the initial list of projects while the rest involved several filtering and manipulation operations. Figure 1 (upper part) illustrates the dataset building process. Table II shows the number of projects and repositories at each phase of the process (including after the metrics calculation, see next section).
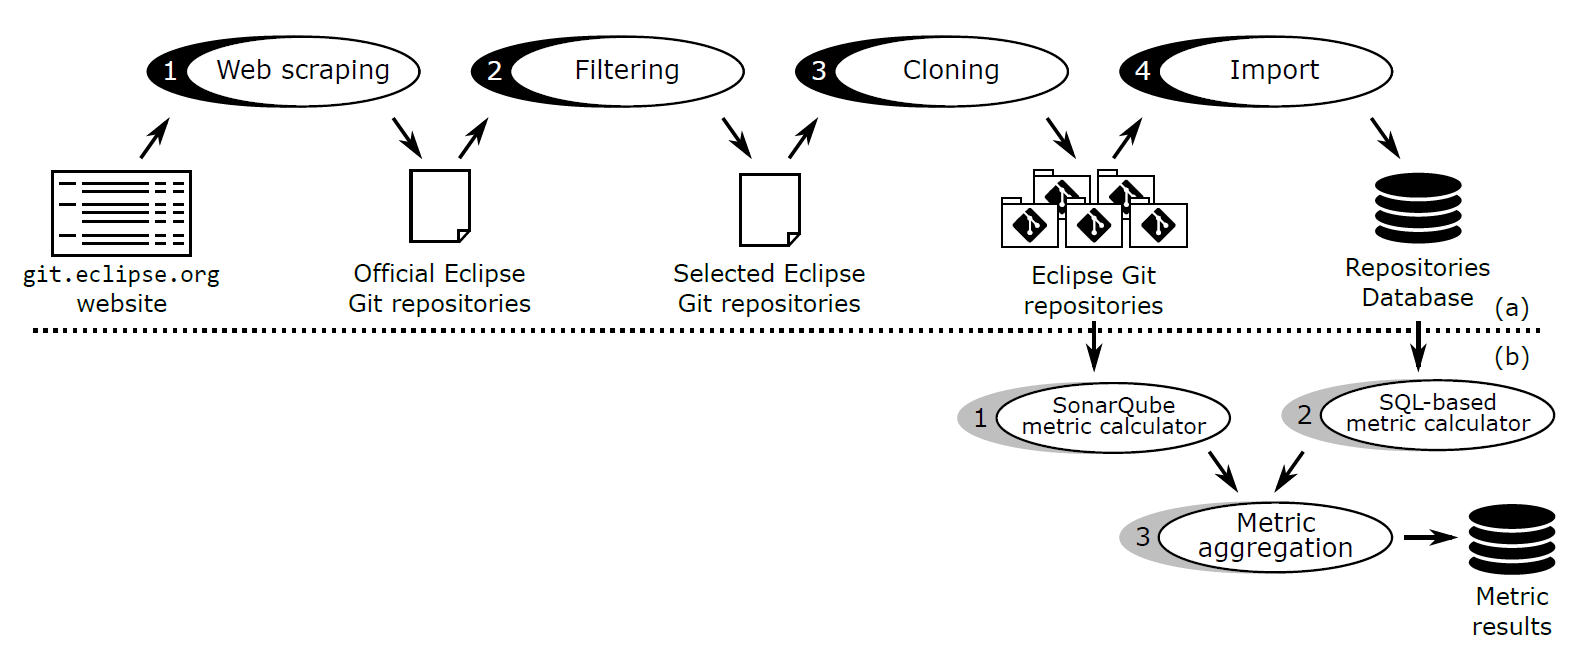
Figure 1: Devised methodology: (a) dataset building and (b) metric calculation processes.
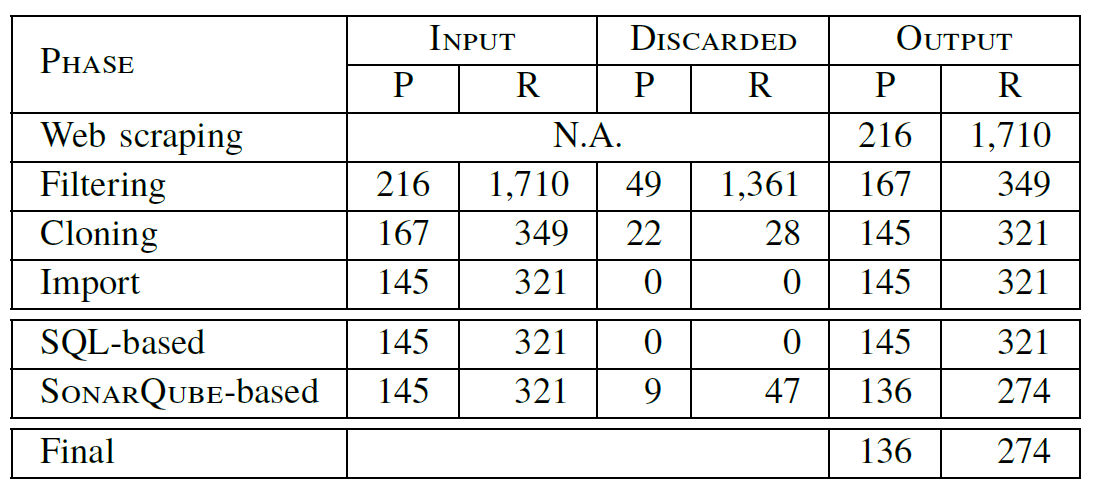
Table II (see first four rows) shows the input/discarded/output projects and repositories for each phase.
Web scraping. The first phase was in charge of obtaining a list of the official Eclipse projects and repositories. To this aim, we developed a web scraping tool that parsed the website listing the set of Eclipse projects. As a result, this phase generated a spreadsheet including the set of projects, their corresponding repositories, and the last time the project was modified (i.e., last activity). The list included 216 projects and 1,710 repositories.
Filtering. We performed a filtering process on the previous list to remove those repositories that either had not been modified in the last year (i.e., removing inactive projects) or were companion repositories not including the core project content (e.g., binary, build or template repositories). We also removed the projects eclipse.org and gerrit, as they represented the project websites and the code review support, respectively. During this phase, we also classified each project according to its purpose (i.e., modeling vs. non-modeling) and its status (i.e., incubation vs. non-incubation). This phase was manually performed by the authors individually, who later discussed together those cases where disagreement was found. At the end of this phase, we reached full agreement on the list of selected projects. The list of selected projects included 167 projects and 349 repositories.
Cloning. We cloned the set of selected repositories obtained in the previous phase at the date of December 14th 2016. We experienced problems when cloning 28 of the selected repositories due to non-existence of the HEAD branch. Thus, we cloned 321 repositories in total, belonging to 145 projects.
Importation. We imported the master branch of the cloned repositories into a relational database using the Gitana tool [23] in order to facilitate the query and exploration of the projects for further analysis. In the Gitana database, the Git repositories are represented in terms of users, files, commits, references (i.e., branches or tags) and file modifications. At the end of this phase, we verified that the number of commits in the database and the Git repository were the same.
3.3 Calculating Metrics
The calculation of metrics for Eclipse projects is performed on each repository and then aggregated to obtain the overall value for the corresponding project.
The process involved two independent phases, depending on the technology used to calculate them, namely: (1) SonarQube metric calculator and (2) SQL-based metric calculator. We also defined a third phase which collects the results of the previous phases and group them per project. Figure 1 (lower part) illustrates the metric calculation process.
SonarQube metric calculator. We configured Sonarqube to calculate a subset of metrics in the product dimension of our maturity model. Sonarqube directly accessed the repositories cloned in the second phase of the dataset building process and produced a web page (and the companion results database populating that webpage) with the metric results.
During this phase we experienced problems when analyzing specific repositories. 40 repositories were discarded as they were implemented in languages not supported by the free analyzers provided by SonarQube (e.g., C or shell script languages). Also, Sonarqube was not able to analyze 7 repositories due to memory issues.
SQL-based metric calculator. We relied on the repositories database obtained with Gitana to calculate most of our metrics. Thus, these metrics are calculated by means of SQL queries and their results are also stored in the database.
Metric aggregator. For the sake of organization, we defined this phase to collect the metric results obtained for each repository in the previous phases. This phase is in charge of calculate the aggregated values (i.e., the average, sum or ratio when suitable) per project.
Table II (see last three rows) shows the input/discarded/output projects and repositories for each phase and the final size of our dataset.
3.4 Dataset Descriptive Statistics
At the end of the process, our dataset consisted of 136 projects (55 modeling vs. 81 non-modeling), where 42 were at an incubation phase while the other 94 had already exited this phase. Figure 2a shows this distribution.
In total, we analyzed 274 repositories linked to the 136 projects (77 modeling repositories vs. 197 non-modeling ones). Processing those repositories, we collected a total number of 547,089 commits, 1,298,352 files and 2,558 contributors, Figures 2b, 2c and 2d show the boxplots for these variables, respectively. Each figure shows four boxplots, split up into modeling vs. non-modeling projects and then into incubation vs. non-incubation. As can be seen, the values of these variables with regard to the incubation dimension are remarkably different, in particular for non-modeling projects. Thus, non-incubation non-modeling projects tend to have higher values with regard to the number of commits, contributors and files than incubation non-modeling projects. This behavior is also slightly observed in modeling projects.
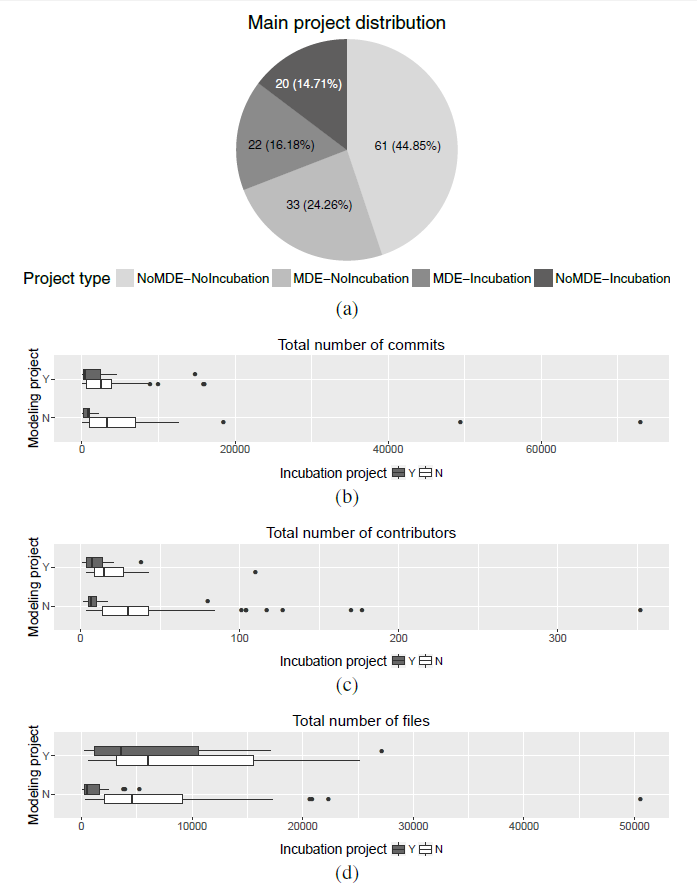
Figure 2: Descriptive statistics of our dataset. (a) Main project distribution. (b) Numbers of Commits. (c) Number of contributors. (d) Number of files.
4 Results
4.1 RQ1: Are modeling projects as mature as non-modeling projects?
To address this research question, we calculated the metrics of our maturity model for each project of our dataset and then grouped the results according to the project purpose, i.e., whether the project is modeling (n=55) or non-modeling (n=81), with the goal to assess whether the distributions of a given metric are different for modeling and non-modeling projects (i.e., a two-level factor). The boxplot for each metric (though decomposed according to the project incubation status) can be seen in Figure 3.

Figure 3: Results for each metric identified in our maturity model according to project type factor.
This assessment is usually performed by applying a two-sided Student’s t-test, which tests the null hypothesis that there are not significant differences in the distributions (we therefore aim at rejecting such hypothesis). Student’s t-test assumptions require the data to both follow a normal distribution and have equality (or “homogeneity”) of variances. To check these assumptions we applied the Saphiro-Wilk normality test for the former and the Barlett test for the latter. Only one of the considered metrics passed the normality test (i.e., prod_comment_density) and most of them did not pass the equality of variances test. As these assumptions were not passed, we could not trust the Student’s t-test results. Table III (see Norm. test and Homog. Var. subcolumns of the Original Variable column) shows these results. As the tests outputs return an overall p-value, to avoid clutter when reporting p-values, we superscript the results using the following convention: no superscript corresponds to p-value ≥0.05 , * corresponds to 0.01≤ p-value <0.05, ** corresponds to 0.001≤ p-value <0.01 and *** corresponds to p-value <0.001.
In these cases, a variable transformation (e.g., log or sqtr) is usually applied. We therefore proceeded as follows. We applied a variable transformation and check whether the variable passes the normality Saphiro-Wilk normality test. As this test is affected by the presence of outliers, when required, we also removed them in order to meet the assumption. We then applied the Barlett test to check the equality of variances. If the variable passes the Barlett test, we achieved to meet the Student’s t-test assumptions and therefore performed the test to check its null hypothesis. Otherwise, we applied the Behrens-Fisher problem, which tests a global null hypothesis checking the difference between the means of two normally distributed populations when the variances of the two populations are not assumed to be equal. Finally, if after exploring and applying variable transformations we did not achieve to pass the previous assumptions (especially the normality test), we applied the Mann-Whitney-Wilcoxon test, which is a nonparametric test where the null hypothesis checks that the population distributions are identical without assuming them to follow the normal distribution (we therefore aim at rejecting such hypothesis). We applied the Mann-Whitney-Wilcoxon test only in those cases where the variable did not pass the Saphiro-Wilk normality test but did pass the Barlett test, as simulation studies suggest that the Mann-Whitney-Wilcoxon test is not robust to unequal population variances, especially in the unequal sample size case [24], which is our case. For variables not passing the normality and equality of variances assumptions (even after applying variable transformations), we cannot trust on the results of the previous tests. We follow this procedure in order to rely first on parametric tests, as they are usually considered to have more statistical power than nonparametric tests and therefore it is more likely to detect a significant effect when one truly exists. With this procedure we were able to study the distribution of all the metrics except for prod_lines_code.
Table III shows the results of this assessment. Column Var. Trans shows the variable transformation applied (not found when no transformation achieved to meet the assumptions or none when not needed). Column Outliers indicates if outliers were included (i.e., value) or not (i.e., × value) after the transformation. Columns Norm. test and Homog. Var. (subcolumns of the Transformed Variable column) show the results of the Saphiro-Wilk and the Barlett tests, respectively. Columns t-test, BF-test and Wilcox show the results for the Student’s t-test, Behrens-Fisher problem and Mann-Whitney-Wilcoxon tests, respectively. To facilitate the reading of the table, we have highlighted in gray those cells that are used for the assessment of the distributions of each metric.

Table 3: Study performed with the metrics of our maturity model versus the project purpose factor (i.e., modeling vs. non-modeling). t-test reports the p-value of the Student’s t test. wilcox reports the p-value of the Mann-Whitney-Wilcoxon test. bf-test reports the p-value of Behrens-Fisher problem.
Our results reveal that there are some significant differences between the metric distributions with regard to the project purpose. Ecosystem metrics seem to behave similarly for modeling and non-modeling projects but we found significant differences for the metrics eco_num_contributors and eco_ratio_casuals, where the values for the non-modeling projects seem to be higher than for modeling projects. This behavior shows a better maturity level in this kind projects and it may also reveal a lower entry barrier to contribute.
Regarding the product dimension, the distributions of the metrics prod_num_extensions, prod_comment_density and prod_technical_debt shown significant differences, where the values for modeling projects tend to be higher than for non-modeling ones, maybe caused by the existence of numerous generated files. The rest of the metrics seem to show higher values for modeling projects, although we did not find significant statistical differences.
4.2 RQ2: Is the incubation status of a project an important factor when comparing modeling and non-modeling projects?
To include the incubation dimension in our analysis, we defined a new factor covering the possible combinations for the project type (i.e., modeling vs. non-modeling) and status (i.e., incubation vs. non-incubation) values. For the sake of simplicity, we refer MDE projects as M and non-MDE as ≠M. Likewise, incubation projects are referred as I and non-incubation as ≠I. We call this new factor type and its levels are MI (n=22), M≠I (n=33), ≠MI (n=20) and ≠M≠I (n=61).
We want to assess whether the distributions of the metrics are different with regard to this new factor. In particular, we want to study the distributions of the metrics between modeling and non-modeling projects when they are in incubation status (≠MI vs. MI) and when not (≠M≠I vs. M≠I). This assessment is usually performed by applying an ANOVA, which tests the null hypothesis that there are not significant differences in the distributions in a pairwise basis (we therefore aim at rejecting such hypothesis). ANOVA assumptions are the same as Student’s t-test ones presented before.
Due to the nature of the metrics (i.e., non-normality and/or non-equality of variances), we proceeded as follows. We applied the variable transformations commented in the previous section and performed an ANOVA when normality and equality of variances tests were met. In those cases where ANOVA assumptions are not satisfied, non-parametric tests are usually applied to confirm or discard the results. Thus, the global null hypothesis is normally tested by applying the Kruskall-Wallis one-way analysis of variance by project type [25] while the pairwise comparison is checked with the rank-based Wilcoxon-Mann-Whitney test [26] with Bonferroni correction [27]. However, as commented before, the Wilcoxon-Mann-Whitney test is not robust to unequal population variances. Therefore we proposed to employ the multiple contrast test procedure ̃T [28], which is robust against unequal population variances. ̃T procedure takes as input a type of contrast and the threshold for the family-wise error rate. We used the Tukey-type contrast with the traditional threshold of 5%.
Table IV shows the results of our analysis, including the study applied (i.e., ANOVA or ̃T in the Study column), the p-value of the study and the pairwise p-values for each metric. The table includes all the pairwise combinations but we are interested in the pairs ≠MI vs. MI (see fourth column) and ≠M≠I vs. M≠I (see fifth column). Figure 3 shows the main boxplots for each metric.
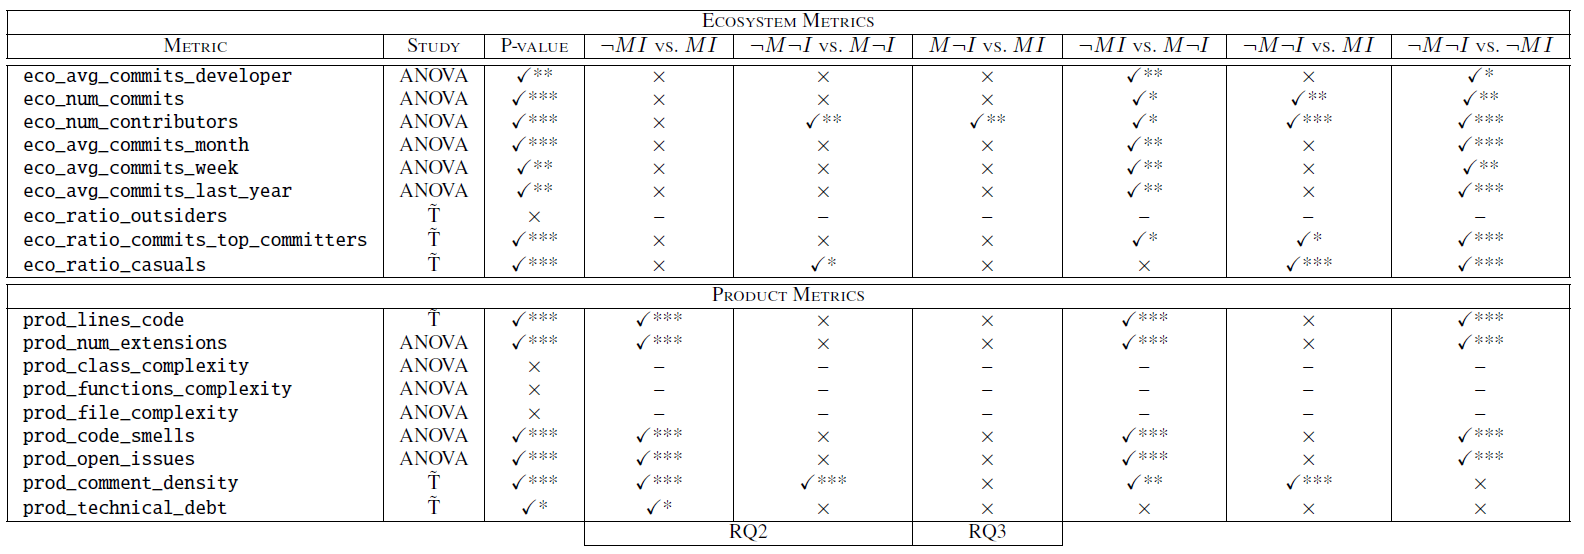
Table 4: Study performed with the metrics of our maturity model versus the project type factor.
The first pair (fourth column in Table IV) focuses the study on the set of incubation projects and compares the distribution of the metrics between modeling and non-modeling ones. As can be seen, while no significant differences were found for ecosystem metrics, there are significant differences in all the metrics of the product dimension except those ones measuring complexity. If we observe the boxplots in Figure 3, we confirm that these metrics tend to have higher values for modeling projects. Except for the metric prod_comment_density, these results reveal lower maturity levels for modeling projects. We believe these results may reveal that modeling projects require extra effort to be consolidated or to demonstrate that the technology can be promoted to non-incubation projects.
The second pair (fifth column in Table IV) focuses the study on the set of non-incubation projects and performs the same comparison as before. In this case, the results show that only the distributions of the metrics eco_num_contributors, eco_ratio_casuals and prod_comment_density differ significantly between modeling and non-modeling projects. While the first two metrics reveal higher maturity levels for non-modeling projects, the last metric benefit the maturity of modeling projects. These results are aligned with previous results obtained in RQ1.
4.3 RQ3: Is the incubation status a valid indicator of the maturity of a modeling project?
To answer this question we relied on the previous analysis but focused on a different pair of scenarios. In particular we are interesting in studying whether the incubation status has an effect within modeling projects, which involves the pair M≠I vs. MI (see sixth column in Table IV). As can be seen, only the metric eco_num_contributors presents significant differences in the distribution. In particular, the number of contributors is significantly higher when the modeling project is classified as a non-incubation one, which may reveal a consolidation and expansion the development team in the project. However, no clear conclusion could be provided regarding changes in the maturity level. Additionally, note that this behavior is also observed for non-modeling projects (see Figure 3c).
Although this research question is specially focused on the analysis of modeling projects, we have also found some interesting results regarding non-modeling projects that we would like to highlight. Thus, the study of the non-modeling projects with regard to its incubation status (last column of Table IV) reveals that the distributions of most of the metrics are significantly different. Interestingly enough, ecosystem metrics changes benefit the maturity levels while product metrics influence negatively, which may show an increment in the community activity but a detriment in the product quality.
5 Extensions to Our Approach
In this section we explore extensions to our approach which may enrich and expand the scope of the maturity analysis.
5.1 Beyond a Git-centric Approach
We have defined a maturity model specially focused on measuring the information in the Git repository of the Eclipse projects. However, the development of any project generally involves other supporting tools such as forums or issue trackers. And Eclipse is not an exception offering Bugzilla and Eclipse forums installations to any Eclipse project. Considering these sources of project information would definitely increase the scope of our maturity analysis. For instance, the activity in Eclipse forums could be included in the ecosystem dimension.=-1
As a proof-of-concept example, we extracted the metadata of the Eclipse forums for two projects of our dataset, namely: (1) Java Development Tools (JDT), a non-modeling project to develop Java applications; and (2) Papyrus, a modeling project which provides an environment to create and manage models (UML, SysML and others). To perform this step, we extended Gitana with some initial support for importing Eclipse Forums. Our importation process obtained the full collection of topics in each project forum until the date of April, 24th 2016.
We defined two metrics to calculate the ratio of messages and contributors per topic in each Eclipse forum, thus allowing us to measure the activity level in each ecosystem. Figure 4 shows the results of these metrics for the timespan recorded in our dataset. As can be seen, there are higher ratio values for Papyrus, which may reveal a richer forum activity.
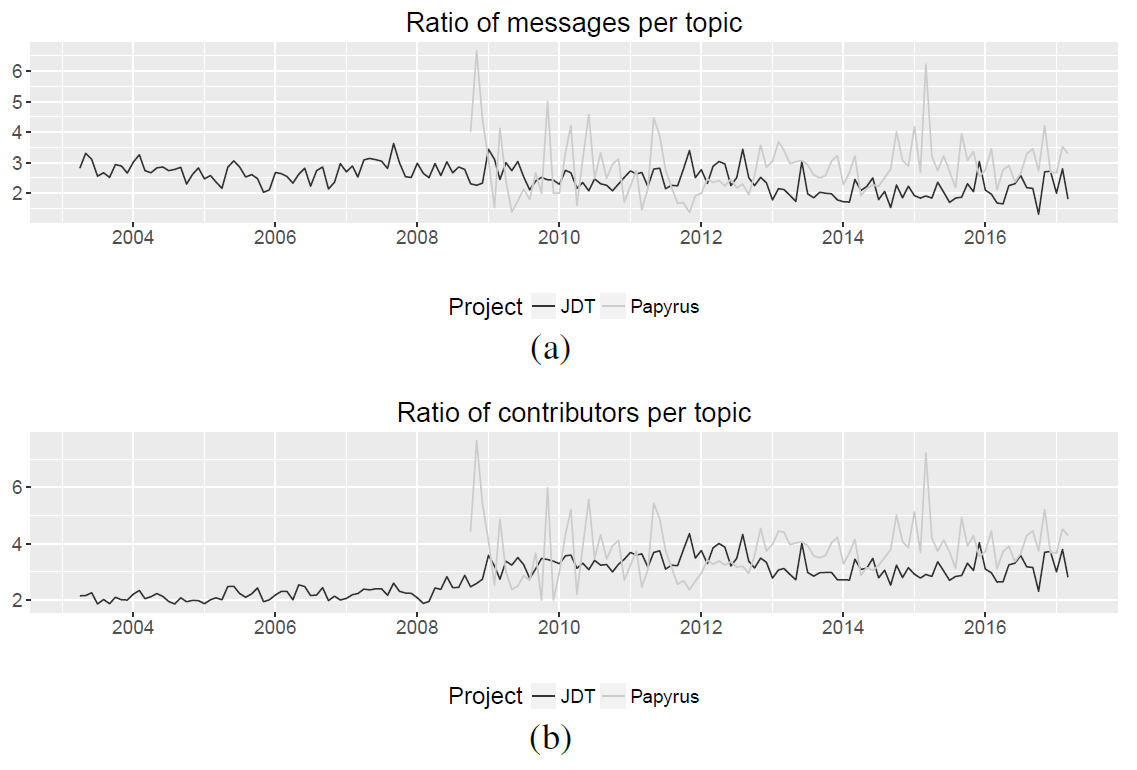
Figure 4: Analysis of the ratio of (a) messages and (b) contributors per topic in JDT and Papyrus forums.
5.2 Collaboration as a key Maturity Dimension
Collaboration is usually considered one of the cornerstones in open-source development, however, it has been neglected in software maturity assessment. The “community” metrics we had so far offered a very limited view on the actual collaboration between the individuals in the community since they focused only on interactions on individual artifacts. We propose to extend maturity models to include an additional dimension to assess the degree of collaboration in the project.
This new dimension could include metrics such as the bus factor, which is a measurement of the concentration of information in individual team members. It connotes the number of team members that can be unexpectedly lost from a project before the project collapses due to lack of knowledgeable or competent personnel. We applied the approach proposed by Cosentino et al. [29] to calculate the bus factor for all projects of our dataset considering their last year of activity. Figure 5 shows the results of this analysis. As can be seen, the bus factor ranges from 1 to 3, and modeling projects seem to have lower bus factor values than non-modeling projects. This result may reveal that modeling projects usually rely on fewer developers, thus meaning that their development and progress can be put at risk easier than for non-modeling projects.
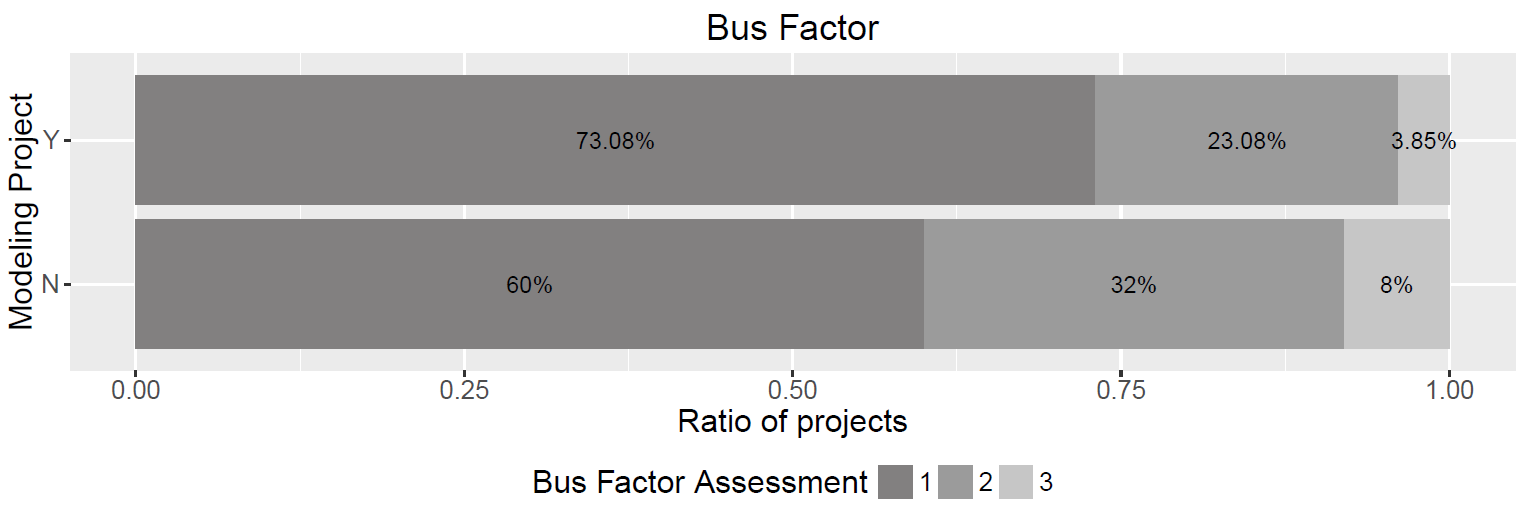
Figure 5: Bus factor.
5.3 Collaboration Beyond the Code
Previous extensions could be combined to assess the collaboration dimension across the project by looking at collaboration networks in forums and issue trackers. In this kind of networks, nodes represent authors of forum (or issue) topics (the bigger the nodes, the higher the number of topics) and edges represent interactions between authors, as they connect authors that have contributed to the same forum topic (the thicker the edge, the more topics they have contributed together).
As an illustrative example, we generated the corresponding collaboration networks for the Eclipse forums of the JDT and Papyrus projects. Figure 5 shows the graphs for JDT (see Figure 5a, with 4,896 nodes and 6,402 edges) and Papyrus (see Figure 5b, with 1,002 nodes and 2,993 edges) projects. As can be seen, the collaboration in the JDT forums is higher in terms of authors and interactions. Well-known graph metrics could then be applied to assess the health of the collaboration network, for instance, betweenness centrality would help to reveal critical paths (and the community members behind them) that concentrate much of the information flows in the network. Mature projects should maximize connections to avoid them. We have colored the nodes of graphs shown in Figure 6 according to their betweenness centrality (the higher the darker), thus facilitating the identification of the main developers in each community.
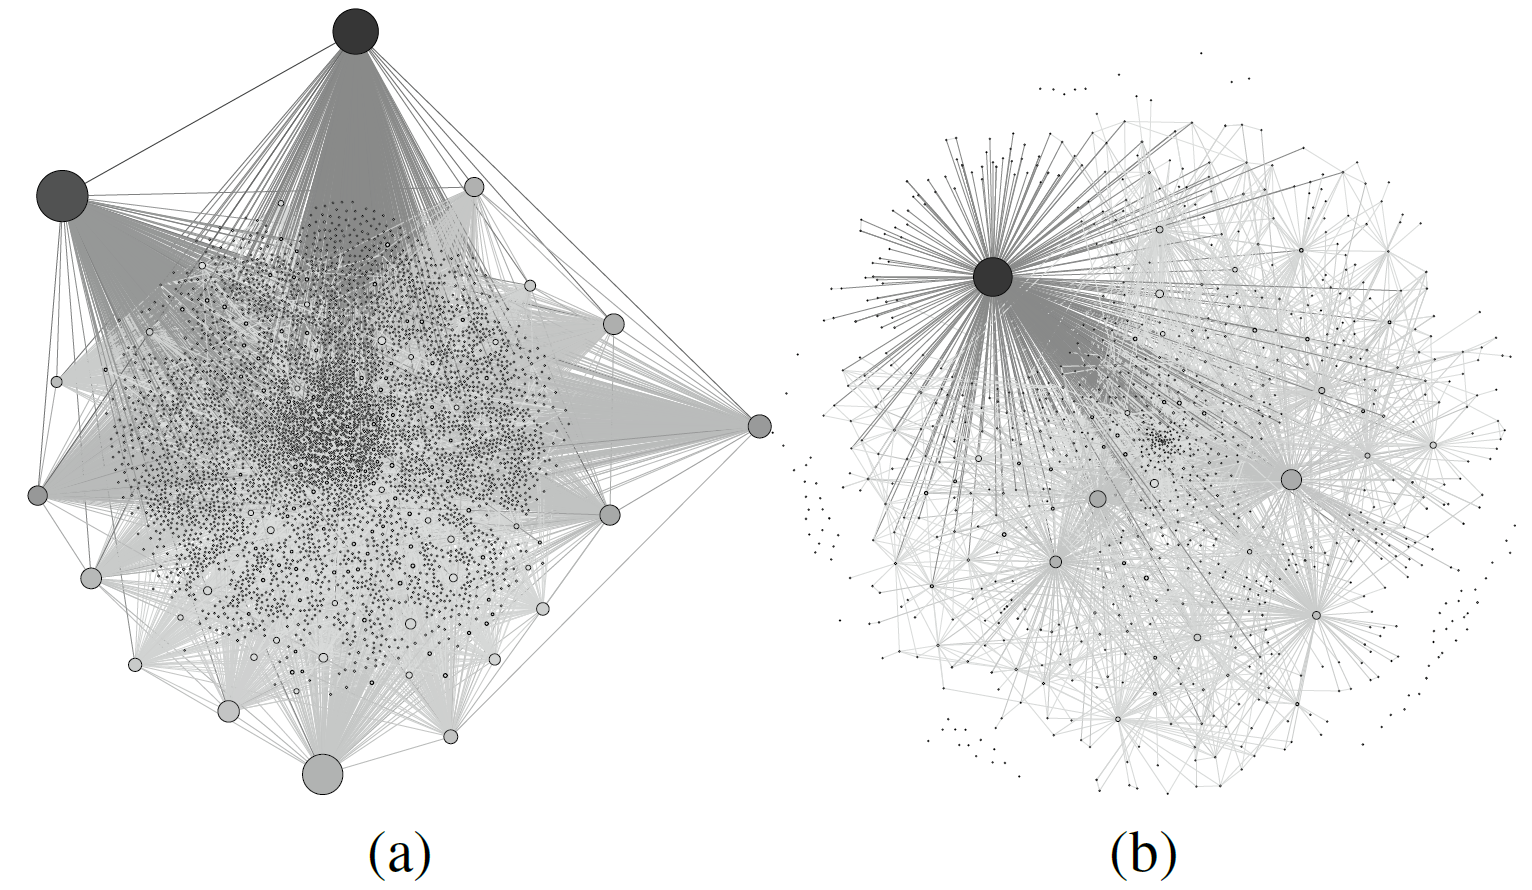
Figure 6: Collaboration graph in (a) JDT and (b) Papyrus Eclipse forums.
6 Replicability Package
To facilitate the replication of our study, we provide a GitHub repository for researchers interested in repeating or complementing our evaluations. The repository includes the main elements of our dataset together with the scripts to populate them, the SQL-based metrics, the R scripts used for the data analysis, graphs, and extra figures of our study.
7 Threats to Validity
Our work is subjected to a number of threats to validity, namely: (1) internal validity, which is related to the inferences we made; and (2) external validity, which discusses the generalization of our findings.
Regarding the internal validity, the dataset construction process faced some problems in the cloning and SonarQube-based metric calculation phases. The former included problems related with the repositories (i.e., HEAD branch non-existence), while the latter was mainly caused by the restricted support SonarQube offers in its free version to analyze code written in some programming languages (i.e., it covers Java, the most popular language in Eclipse, and Javascript but, e.g., not C or shell script which were also relevant for some projects in our initial dataset). To have a fair comparison, we removed projects for which we were unable to calculate all data points.
Another threat is related to our choice of statistical methods and techniques. To minimize this, we have carefully reported each step of our study and also provided a companion package (see Section VI) to promote replicability.
As for the external validity, note that our sample is based on the set of Eclipse projects available as of December 2016 and therefore our results should not be generalized to other development platforms or projects hosted in private repositories.
8 Related Work
Several works have studied how to measure the maturity of MDD in organizations. Rios et al. [10] proposed a maturity model for MDD in the context of the Capability Maturity Model Integration (CMMI). Baker et al. [3] studied the application of MDD techniques in Motorola, thus developing the Modeling Challenge Levels (MCL), a framework that serves as a self-assessment tool to an organization’s modeling maturity. Tomassetti et al. [4] surveyed a set of software professionals of the Italian industry to investigate the level of maturity in the usage of software models and MDD techniques. Mohagheghi et al. [11] identified several quality dimensions that affect the maturity in MDE, including models, modeling languages, tools, processes and quality assurance techniques. While they provide suitable frameworks to evaluate the maturity level, they do not perform any evaluation involving a current sample of tools.
Our work is also related to the popular field of mining and analysis of software repositories [30]. Still, only a few of them have a focus on extracting some kind of modeling-related information from the repositories. Among them, we can cite Kolovos et al. [31], who assessed the existence of MDE artifacts in GitHub projects; Hebig et al. [32], where authors studied how and when UML models are added to a development project; Xiao et al. [33], that studied whether code generated using MDE techniques is free from technical debt; and Kahani et al. [34], that collected and analyzed the content of the 30 most widely used Eclipse forums associated with different modeling tools and applied text mining techniques to study the main questions raised when using these tools. To the best of our knowledge, nobody has done a study similar to ours comparing modeling and non-modeling projects.
9 Conclusion
In this paper we have compared over a hundred modeling and non-modeling projects of the Eclipse ecosystem. Our results show that there are indeed differences between modeling and non-modeling projects, though less than we expected when setting up the study. Also, we detected that incubation status clearly makes a difference for non-modeling projects, however, it is not true for modeling ones which seem to remain much more stable across their lifespan. This is not necessarily a good thing since it may suggest that they are unable to bring a broader audience of users and contributors even after they get out of the incubation status and became full official projects.
While these results partially confirm that maturity of modeling projects may be an issue (with ramifications to even major issues like modeling adoption as both properties have been linked together in previous works), much more research needs to be done to really understand the technical and social factors that make both families of projects different and what dimensions of modeling projects can be improved to make them up to par (or even better).
We have proposed a couple of extensions to “classic” maturity models that could shed some light on these issues. This is our main line of further work. Beyond this, we plan to replicate the results in other ecosystems outside Eclipse.
Acknowledgment
This work has been supported by the Spanish government (TIN2016-75944-R project).
References
[1] A. G. Kleppe and J. W. W. Bast, MDA Explained: The Model Driven Architecture: Practice and Promise. plus 0.5em minus 0.4em Addison-Wesley, 2003.
[2] B. Anda, K. Hansen, I. Gullesen, and H. K. Thorsen, “Experiences from Introducing UML-based Development in a Large Safety-critical Project,” Empirical Software Engineering, vol. 11, no. 4, pp. 555–581, 2006.
[3] P. Baker, S. Loh, and W. Franck, “Model-Driven Engineering in a Large Industrial Context – Motorola Case Study,” in Int. Conf. on Model Driven Engineering Languages and Systems, 2005, pp. 476–491.
[4] F. Tomassetti, M. Torchiano, A. Tiso, F. Ricca, and G. Reggio, “Maturity of Software Modelling and Model Driven Engineering: A Survey in the Italian Industry,” in Int. Conf. on Evaluation & Assessment in Software Engineering, 2012, pp. 91–100.
[5] M. Petre, “”No shit” or “Oh, shit!”: Responses to Observations on the Use of UML in Professional Practice,” Software and System Modeling, vol. 13, no. 4, pp. 1225–1235, 2014.
[6] T. Gorschek, E. D. Tempero, and L. Angelis, “On the Use of Software Design Models in Software Development Practice: An Empirical Investigation,” Journal of Systems and Software, vol. 95, pp. 176–193, 2014.
[7] B. Selic, “What Will it Take? A View on Adoption of Model-based Methods in Practice,” Software and System Modeling, vol. 4, no. 11, pp. 516–526, 2012.
[8] J. Hutchinson, J. Whittle, M. Rouncefield, and S. Kristoffersen, “Empirical assessment of MDE in industry,” in Int. Conf. on Software Engineering (ICSE), 2011, pp. 471–480.
[9] A. Vallecillo, “On the Industrial Adoption of Model Driven Engineering. Is your company ready for MDE?” Int. Journal of Information Systems and Software Engineering for Big Companies, vol. 1, no. 1, pp. 52–68, 2014.
[10] E. Rios, T. Bozheva, A. Bediaga, and N. Guilloreau, “MDD maturity model: A roadmap for introducing model-driven development,” in Int. Conf. on Model Driven Architecture Foundations and Applications, vol. 4066 LNCS, 2006, pp. 78–89.
[11] P. Mohagheghi and J. Aagedal, “Evaluating Quality in Model-Driven Engineering,” in Int. Workshop on Modeling in Software Engineering, 2007, pp. 6–6.
[12] “ISO/IEC 25000:2005. Software engineering – Software product Quality Requirements and Evaluation (SQuaRE) – Guide to SQuaRE,” International Organization for Standardization, Standard, 2005.
[13] “ISO/IEC 9126. Software Engineering – Product Quality,” International Organization for Standardization, Standard, 2005.
[14] “The TRL Scale as a Research & Innovation Policy Tool, EARTO Recommendations,” EARTO, Technical report, 2014.
[15] Polarsys Maturity Model, http://dashboard.polarsys.org/documentation/qualitymodel.html, (Accessed 03-14-2017).
[16] R. van Solingen, V. Basili, G. Caldiera, and H. D. Rombach, Goal Question Metric (GQM) Approach. plus 0.5em minus 0.4em John Wiley & Sons, Inc., 2002.
[17] T. J. McCabe, “A Complexity Measure,” IEEE Trans. Software Eng., vol. 2, no. 4, pp. 308–320, 1976.
[18] Y. Ayalew and K. Mguni, “An Assessment of Changeability of Open Source Software,” Computer and Information Science, vol. 6, no. 3, pp. 68–79, 2013.
[19] M. Lungu, “Towards Reverse Engineering Software Ecosystems,” in Int. Conf. on Software Maintenance and Evolution, 2008, pp. 428–431.
[20] G. Pinto, I. Steinmacher, and M. A. Gerosa, “More Common Than You Think: An In-depth Study of Casual Contributors,” in Int. Conf. on Software Analysis, Evolution and Reengineering, 2016, pp. 112–123.
[21] R. Padhye, S. Mani, and V. S. Sinha, “A Study of External Community Contribution to Open-source Projects on GitHub,” in Working Conf. on Mining Software Repositories, 2014, pp. 332–335.
[22] C. B. Seaman and Y. Guo, “Measuring and Monitoring Technical Debt,” Advances in Computers, vol. 82, pp. 25–46, 2011.
[23] V. Cosentino, J. L. Cánovas Izquierdo, and J. Cabot, “Gitana: A SQL-Based Git Repository Inspector,” in Int. Conf. on Conceptual Modeling, 2015, pp. 329–343.
[24] D. Zimmerman and B. Zumbo, “Parametric Alternatives to the Student t-test under Violation of Normality and Homogeneity of Variance,” Perceptual and Motor Skills, vol. 74, pp. 835–844, 1992.
[25] M. Hollander, W. Douglas, and E. Chicken, Nonparametric Statistical Methods, 2nd Edition. plus 0.5em minus 0.4em Wiley-Interscience, 1999.
[26] F. Wilcoxon, “Individual Comparisons by Ranking Methods,” Biometrics Bulletin, vol. 1, no. 6, pp. 80–83, 1945.
[27] O. Dunn, “Multiple Comparisons among Means,” Journal of the American Statistical Association, vol. 56, no. 293, pp. 52–64, 1961.
[28] H. Konietschke, L. Hothorn, and E. Brunner, “Rank-based Multiple Test Procedures and Simultaneous Confidence Intervals,” Electronic Journal of Statistics, vol. 6, pp. 738–759, 2012.
[29] V. Cosentino, J. L. Cánovas Izquierdo, and J. Cabot, “Assessing the bus factor of Git repositories,” in Int. Conf. on Software Analysis, Evolution, and Reengineering, 2015, pp. 499–503.
[30] V. Cosentino, J. L. Cánovas Izquierdo, and J. Cabot, “A Systematic Mapping Study of Software Development with GitHub,” IEEE Access, vol. 5, pp. 7173–7192, 2017.
[31] D. S. Kolovos, N. D. Matragkas, I. Korkontzelos, S. Ananiadou, and R. F. Paige, “Assessing the Use of Eclipse MDE Technologies in Open-Source Software Projects,” in Workshop on Open Source Software for Model Driven Engineering, 2015, pp. 20–29.
[32] R. Hebig, T. Ho-Quang, M. R. V. Chaudron, G. Robles, and M. A. Fernández, “The Quest for Open Source Projects that Use UML: Mining GitHub,” in Int. Conf. on Model Driven Engineering Languages and Systems, 2016, pp. 173–183.
[33] X. He, P. Avgeriou, P. Liang, and Z. Li, “Technical debt in MDE,” in Int. Conf. on Model Driven Engineering Languages and Systems, 2016, pp. 162–172.
[34] N. Kahani, M. Bagherzadeh, J. Dingel, and J. R. Cordy, “The Problems with Eclipse Modeling Tools: A Topic Analysis of Eclipse Forums,” in Int. Conf. on Model Driven Engineering Languages and Systems, 2016, pp. 227–237.

I’m an Associate Professor at UOC and researcher at SOM Research Team, in Barcelona, Spain. My research interests are mainly focused on Model-Driven Engineering (MDE), Domain-Specific Languages and Collaborative Development.


Recent Comments