
Greg Wilson pointed me to the paper A. De Lucia, C. Gravino, R. Oliveto, G. Tortora, An Experimental Comparison of ER and UML Class Diagrams for Data Modelling, Empirical Software Engineering (2010) (if you cannot access the paper, you may try directly contacting the authors).
The paper presents the results of three sets of controlled experiments aimed at analyzing whether UML class diagrams are more comprehensible than ER diagrams during data models’ maintenance. In particular, the experiments show that when using UML class diagrams subjects achieved 1 – better comprehension levels, 2 – same results in maintenance activities and 3 – better support during verification activities
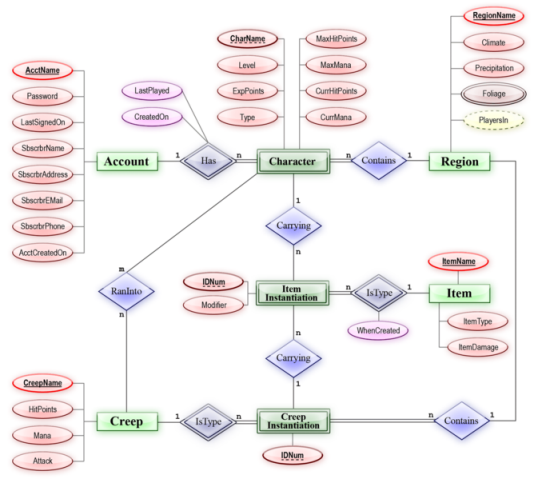
The reason they give to explain these results is that UML is a more concise graphical notation than ER, in particular regarding the representation of attributes in ER diagrams. I should clarify that the ER notation they use in the study represents attributes as ovals outside the “class” box, as shown in the following image (taken from the Wikipedia description of ER diagrams).
Therefore, the results of this study could differ when using some of the alternative (more compact) notation styles for ER diagrams. Anyway, the fact that UML is not worse than ER diagrams (at least in terms of the properties analyzed in the paper) is very good news, considering that ER could be regarded as a DSL for data modeling and UML is more a general-purpose modeling language. In fact, I used ER diagrams professionally for some years but after UML came out I stopped and replaced them with UML class diagrams, which are easier to integrate with the rest of the (UML) software models (use case diagrams, sequence diagrams,…). Of course, UML is not perfect either. For instance, this is one key modeling feature I miss from the ER language.
FNR Pearl Chair. Head of the Software Engineering RDI Unit at LIST. Affiliate Professor at University of Luxembourg. More about me.


I am not surprised they came to this result by comparing UML with Chen ER Notation. For a more serious comparison, see for example http://www.tdan.com/view-special-features/8457.
Best regards,
Chris (unclechrisblog.blogspot.com)
Several people agree that using a more compact ER notation the results would have been different (and maybe completely opposite since some people feel that ER is more comprehensible than the UML).
However, we cannot use “feelings” as scientific evidence so, who is up for repeating the experiment using another ER notation?
Until then, we have to accept that, at least, for this particular ER notation, UML is easier to understand
thanks for the enlightenment of UML class diagrams, and useful for database programmers lovers.