Our work “MetaScience: an Holistic Approach for Research Modeling” has been accepted at ER2016. This article proposes a conceptual schema providing a holistic view of conference-related information (e.g., authors, papers, committees and topics). This schema is automatically and incrementally populated with data available online.
Conferences have become primary sources of dissemination in computer science research, in particular, in the software engineering and database
fields. Assessing the quality, scope and community of conferences is therefore crucial for any researcher. However, digital libraries and online bibliographic services offer little help on this, thus providing only basic metrics. Researchers are instead forced to resort to the tedious task of manually browsing different sources (e.g., DBLP, Google Scholar or conference sites) to gather relevant information about a given venue.
In this post we present MetaScience, an approach that collects and integrates research data from different sources, and store it in a relational database derived from our proposed conceptual schema. The schema can be then used as a single information source to perform a variety of complex queries and metrics in order to get insights about a given conference.
The main contributions of the paper are:
- The definition of a conceptual schema that provides a holistic, homogeneous and detailed representation of all kinds of conference-related information
- An approach able to collect and integrate data from different heterogeneous sources (e.g, bibliographic metadata, conference websites) by applying a plethora of extraction techniques (i.e., database import, web scraping and dump processing) tailored to the nature of each data
source - An incremental update mechanism that can be triggered at any moment to refresh and keep the database updated with the latest information
available online - A set of metrics and graph-based community analysis to draw interesting information (useful for steering committees, PC Chairs,individual researchers…) from all these data
You can read the article here, check the presentation or continue reading below. Some of the metrics are available as an online service here (additional details).
Contents
Introduction
Conferences play a key role in the research community specially in many areas of Computer Science (CS) where they are the primary source for researchers to present and discuss new results and ideas [1, 2]. Availability of conference analytics is therefore a fundamental information for both researchers, looking for a venue to submit their work, and organizers (e.g., steering and program committee chairs), in need of monitoring its health (e.g., evolution of papers accepted and community).
Current analytics so far are mostly limited to assessment of basic common indicators such as ranking, citation indexes and acceptance rates, usually available in digital libraries and bibliographic services. However, relevant information on the author community (e.g., openness towards new researchers), author profiling (e.g., most prolific authors, author clustering) or composition of the Program Committee (PC) are often not available or scattered thus forcing researchers to perform tedious and manual browsing to get the information they need in a process that does not scale.

Fig. 1 Overview of METASCIENCE.
In this paper we propose a conceptual schema that provides an holistic, homogeneous and detailed representation of all kinds of conference-related information. A relational database is derived from our conceptual schema and populated through an extraction mechanism that collects and integrates data from different heterogeneous sources such as bibliographic metadata, conference websites, quality indicator services and a number of digital libraries by applying a plethora of extraction techniques (i.e., database import, web scraping and file processing) tailored to the nature of each data source. Our approach incorporates an incremental update mechanism that can be triggered at any moment to refresh and keep the database updated with the latest information available online.
The obtained data can therefore be used to better understand how conferences behave by automatizing the calculation of conference analytics. Thanks to our homogeneous and integrated representation, we can perform this calculation at a massive scale (e.g., to compare conference results across subfields) and going beyond pure publication analysis (e.g., studying publication patterns of PC members when compared with non-PC members), something that was not feasible until now. We illustrate some of the metrics on the ER conference itself. Tool support for the whole process is provided and a web service focusing on individual summary metrics is also available.
The remainder of the paper is organized as follows. Section 2 introduces our approach together with the conceptual and database schemas. Section 3 describes the data collection while Section 4 focuses on conference metrics. Section 5 discusses implementation details. We conclude by presenting the related work in Section 6 and future research directions in Section 7.
Approach
We propose a conceptual schema to model all relevant aspects of research conferences. This schema is materialized as a relational database and populated from a variety of partial sources through an incremental update mechanism. The resulting database can then be queried to calculate a number of quality metrics for the conferences (individually or to compare them). Figure 1 shows an overview of our approach. Both layers can be easily extended to add new data sources and metrics.
In the remainder of this section, we describe the conceptual schema and the corresponding database schema, key components of our approach. Next sections describe the other elements of the data collection and data analytics layers.

Fig. 2. METASCIENCE conceptual schema.
Conceptual Schema for research
Figure 2 shows the conceptual schema depicted as a UML class diagram. The main concepts include: Researcher, Paper, Conference and ConferenceEdition. They represent respectively, individuals involved in a conference (publishing or being part of committees), publications, conferences and the corresponding editions. The associations among these concepts allow representing the authors of the publications (see papers association), where papers were published (see publishedIn association), their citations (cites), the conference committees (programCommitteeChairs, programCommittee and steeringCommittee) and the conference editions (conferenceEdition).
The schema also models the order of the authors and their affiliation in each paper (see Authorship association class). Researchers can also be identified with different aliases (see aliases) and have several profiles (see Profile) like Google Scholar or ResearchGate. Conference editions are organized by an institution (see association between ConferenceEdition and Institution) and define a set of topics of interest (see association between ConferenceEdition and Topic). Conferences can be a satellite event of others (see association isSatellite) or the result of merging two or more conferences (see association merges).
Additionally, the schema embeds a set of concepts to facilitate the classification of papers and conferences. The concepts Category, Topic, Track define respectively the category of a paper (e.g., short paper, long paper), the topics assigned to it, and the conference track where it was assigned. The concepts Domain and Rank describe the domains and rank assigned to a conference. Finally, concepts in the schema can be enriched with some calculated metrics, expressed as derived attributes like the number of citations for researchers (see the attribute citations) or the ratio of papers per author and authors per paper for each conference edition (attributes papersPerAuthor and authorsPerPaper).
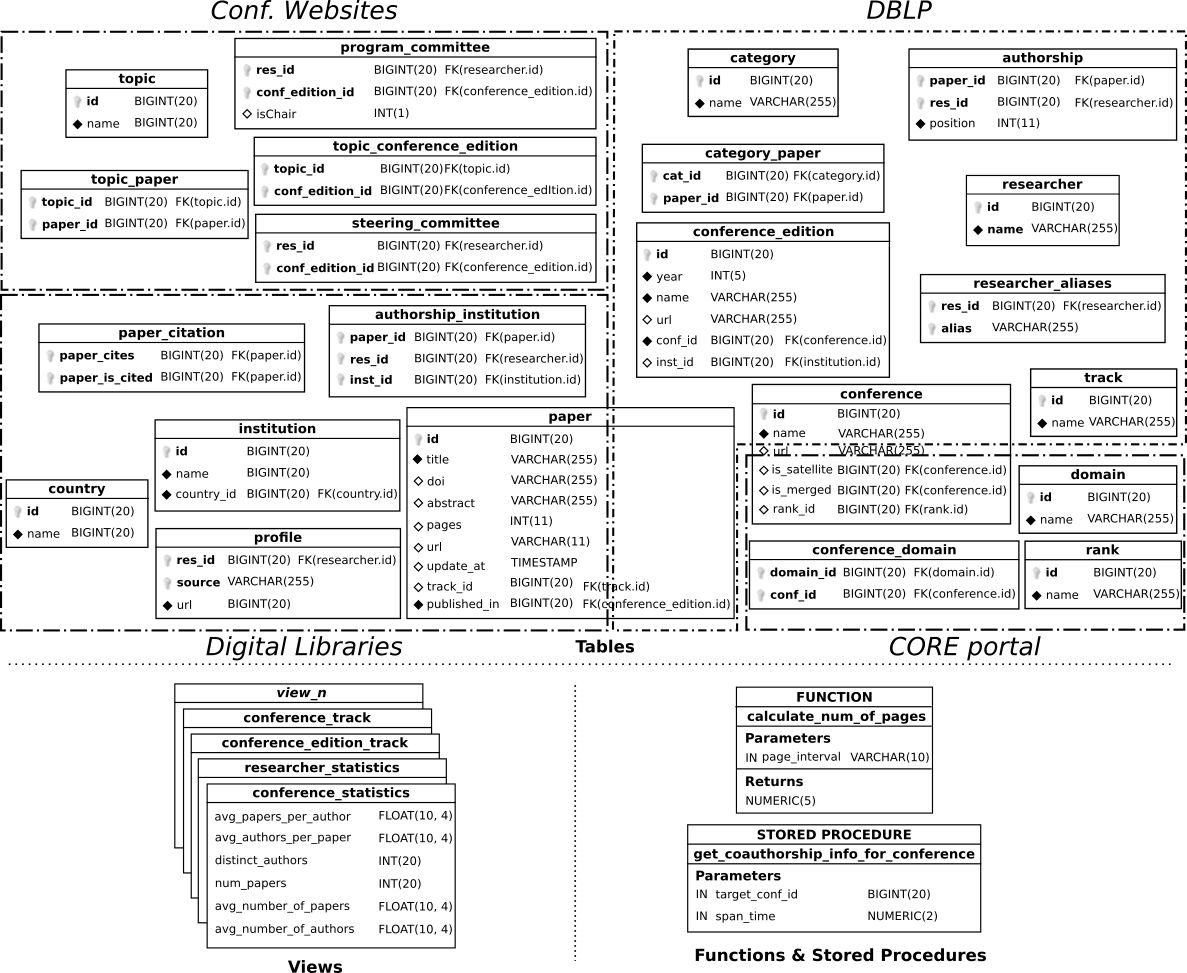
Fig. 3. METASCIENCE database schema.
Database Schema
The database schema shown in Figure 3 is derived from the conceptual schema previously presented. In a nutshell, concepts/attributes in the conceptual schema are mapped into tables/columns in the database schema and associations are mapped into foreign keys (e.g., track in Paper concept is mapped to track_id foreign key in paper table) or new tables (e.g., topic_paper table) depending on the cardinality of the association, fol- lowing the typical translation strategies. Note that the association class has been mapped into a new table (see authorship table).
Additionally, several views have been created in the database to store the derived attributes (e.g., conference_statistics view). Auxiliary methods have been implemented as either functions or stored procedures (e.g. calculate_num_of_pages). These elements calculate basic aggregated data that will be frequently accessed when defining more complex metrics. Full description of these views and methods can be found in the repository hosting the tool.
Data Collection
The data collection layer includes several components to collect specific information from different data sources. In particular, we consider (1) bibliographic metadata, (2) conference websites, (3) digital libraries and (4) quality indicator services. Bibliographic metadata includes information about papers, researchers, authorship, conferences, their editions and tracks, obtained from DBLP. Conference websites are used to retrieve committee members (e.g., steering and program committees) and topics of interest. Digital libraries are accessed to collect data about paper abstracts and citations as well as researchers’ profiles and affiliation institutions. Finally, conference ranking information and conference domains can be derived, for instance, from the CORE Rankings portal . In the following we give details about the import process for each source.

Fig. 4. Overview of the extraction process for DBLP.
Importing DBLP data
Figure 4 shows an overview of the extraction process for DBLP data. It concerns both the DBLP database and website since the database dump does not contain all information available in the website, e.g., conference tracks.
In a nutshell, the DBLP database includes a set of relational tables to store information about publications and authors. Publication details are stored in the table dblp_pub_new and include, among others, its type, title, page intervals, year and the link to the DBLP web page where the publication is located. Author tables keep track of their position in papers (table dblp_author_ref_new), their names (table dblp_authorid_ref_new) and possible name aliases (table dblp_aliases_new). In the following, we describe how information contained in the DBLP database and website are processed and imported in our database.
Researchers, Papers and Authorship data. Authors and their aliases stored in the DBLP database are mapped into the tables researcher and research_alias of our database. A similar approach is followed to populate papers and authorship details, thus filling the paper and authorship tables. Additionally, at this stage, also the tables category and category_paper are populated. Currently, the papers are categorized according to their number of pages (e.g., less than 11 pages as short papers) since there is no explicit information about a paper category in DBLP. This value can be configured to adapt to specific page lengths for a given conference.
Conference data. We rely on the analysis of the proceedings of each conference in the DBLP database to fill the tables regarding the information for conferences (conference, their editions conference_edition) and conference relationships (attributes is_satellite and is_merged in table conference). The actual name of the conference is retrieved by web scraping the conference page on the DBLP website, since, surprisingly, this information is not present in the database.
Tracks data. Tracks assigned to papers are obtained by a web crawler visiting the DBLP web page of the conference edition where the paper metadata is located. For each paper, its position on the web page is retrieved according to its title and then the name of the assigned track is collected by selecting the first HTML header that precedes it. The obtained information is finally stored in the table track and linked to the corresponding paper (attribute track_id in table paper), and then aggregated in the views conference edition track and conference track.
Web Scrapping Conference Websites
Topics of interest and committees (e.g., program and steering committees) are listed on the conference website, but each website follows a different structure (e.g., number of pages, content of each page, completeness of the data). Given this heterogeneity we have devised a semi-automatic extraction process that leverages on web scraping techniques and a Domain Specific Language (DSL) to configure the scraping process.
Figure 5 shows an overview of the extraction process. It takes as input the URL of the conference web page where the target information is located, and additional information about the conference (i.e., its acronym and the edition under analysis) and type of data to be extracted (e.g., topics, steering committee). Then, a set of heuristics based on text mining techniques generate an instance of our DSL, i.e., an initial configuration. This configuration is then used to (1) instruct a crawler to locate and return the topics/committee members in the web page and (2) drive the insertion of the data obtained to our database. Both the DSL instance and the data collected by the crawler can be manually checked and tuned if needed by the user.
The current defined heuristics are able to locate the list of elements required in the extraction process (i.e., topics or committee members) and isolate the single elements by using a pattern-based search. The location of the target data is achieved by searching for specific words that may precede (e.g., topic, committee, PC) and follow it (e.g., important dates, submission). Then, the target data is analyzed to determine the single elements and the contained relevant text by leveraging on the most frequent HTML tags and non-alphanumeric symbols used.

Fig. 5. DSL attributes for HTML, TEXT-IN-HTML and TEXT modes.
The DSL, shown in Fig. 5, can be executed in three different modes, namely, HTML (when information is encoded in HTML format), TEXT (pure text) and TEXT-IN-HTML (a mixture of both), depending on the availability of the target information and how it is coded in the web page. Each mode is composed by a set of parameters that can be mandatory, optional (see question marked attributes) or specific to extract committee members (see bold attributes). These attributes are grouped in 3 blocks: (1) selection block, which drives the location of the target elements; (2) processing block, which defines text processing rules to remove extra data that may appear together with the target elements; and (3) insertion block, which specifies where to insert the elements to our database.
The selection block contains the link of the web page to analyze, the HTML tag (member_tag) enclosing the target elements and, optionally, other tags and text used as delimiters (e.g., ol tags in enumerations) and/or a filter (e.g., to select HTML tags with a given id). The processing part defines regular expressions applied to each single element to isolate the target information (member_remove_before and member_remove_after). However, exceptions can be defined for elements for which the regular expression fails. When dealing with committee members, the parameter role defines the type of role to retrieve (i.e., normal member or chair), the parameter inverted_name is used when the first and last names are inverted and the parameter mixed_roles is used when normal members and chairs are listed together. On the other hand, the insertion parameters are used to insert the selected elements in our database for a specific venue, year and type (i.e., type of committee or topic).
This process is repeated at least twice for each conference website of a given edition, one targeting the topics and the other targeting the PC. If available, we can also used it to extract the Steering Committee (SC). When dealing with the PC, an important step is the matching between the names in the web page and researcher names in our database (stored in our database (researcher and researcher_alias tables). We use well-known identity matching / entity resolution algorithms (e.g., [3, 4]) for this.
Accessing Digital Libraries
Information about paper abstracts, institutions, citations and profiles can be obtained by mining popular digital libraries. Our extraction process relies on Google Scholar, a free public search engine for academic papers and literature. For each paper, the platform provides links to the digital library hosting it, to the papers citing it and to the author profiles on the platform. However, as the platform does not provide any API to execute queries programmatically, we have devised an extraction process based on web-scraping techniques as well though using a different approach than for conference websites.
The extraction process takes as input a list of paper titles and their identifiers from our database. A crawler then visits Google Scholar, sends each title as query string and locates the corresponding hit by measuring the Levenshtein distance between the title hit and the input title. Once the title is matched, first the attribute updated_at of the paper being analyzed is set to the current timestamp (this information will be used for the update process). Then, the links to (1) the web page of the digital library hosting the paper, (2) the citations page and (3) the profiles of the authors, are passed to three different processes together with the paper identifier. Such processes, described below, collect the desired information.
Paper Abstract and Institution. Abstracts and institutions are obtained by launching a crawler able to deal with a battery of popular digital libraries (i.e., IEEE Xplore, Springer Link, ScienceDirect, IEEE Computer Society, ACM), depending on the publishing source for the conference. The collected abstracts are used to update the corresponding paper stored in the table paper. Affiliation information is first assigned to the authors according to their position in the paper, and then processed and inserted in the tables country, institution and authorship_institution.
Citations. The citation information is collected by a crawler that navigates through the papers listed in the citations pages. The titles are matched with those ones stored in our database by measuring their resulting Levenshtein distance. For each match, the identifiers of the citing and cited papers are stored in the table paper_citation.
Profiles. The process to extract the Scholar profile relies on a crawler that accesses the link passed as input and collects the name of the researcher visible on his profiles. Next, the obtained name is used to retrieve the corresponding identifier stored in our database, by relying on his position in the paper being analyzed. The identifier and the link are then stored in the table profile. Additionally, the name collected from the web crawler is used to enrich the aliases in our database (researcher_alias table) if it has not been tracked before.
Importing CORE Rankings
CORE classifies over 1,700 conferences and workshops in computer science. No conference rankings are perfect (see our analysis of CORE rankings on “Conference rankings, do they make any sense?“) nor we claim CORE is the best one. But as the most popular one we chose it as the input source to populate this section of the database. Each venue is represented by a name and acronym and is associated to a rank and one or more domains, also called fields of research. This information can be exported as a CSV file. Thus, we have defined an extraction process that processes this CSV to first match the conferences with those ones included in the database based on equal acronyms and, if needed, on the Levenshtein distance calculated between their names. The matched conferences with their rank and domain information are serialized to a textual format to allow a manual verification if so desired. Once the match has established, the rest of the CSV data is used to populate the tables domain, rank, conference_domain and the attribute rank in the table conference.
Incremental Update Process
The goal of the update operation is two-fold: it refreshes the data concerning paper citations and researcher profiles already stored in our database, and it completes the database by adding information about new conference editions, conferences and researchers. Due to lack of space we cannot describe herein the details of the process but in a nutshell, for the synchronization of papers we use the attribute update_at of the table paper to know when that paper was updated for the last time while for full conferences/editions we compare their identifiers with those in DBLP to detect new elements to import, and then trigger the process to recover all the related data for them.
Data Analytics for conferences
In this section we illustrate how METASCIENCE can be used to (1) automate the calcu- lation of quality metrics that so far had to be manually processed, and (2) enable more ambitious analysis that were not feasible before. Due to space limitations, we show a variety of analysis that can be achieved with METASCIENCE, however by leveraging on the data stored in our database, the user is free to compute any metric he/she wants.
In particular, we discuss four possible dimension analysis: (1) general, (2) co-authorship, (3) program committee and (4) topics. Next we present how each one may be addressed and illustrate them by applying the metrics to this same Int. Conf. on Conceptual Modeling. It is worth noting that the same metrics can be replicated for any conference, and be used to compare conferences each other.
General
We define four basic metrics to characterize essential information for each conference edition, namely: Num_papers (number of accepted papers); Num_authors (number of unique authors); Papers_per_Author (ratio of papers per author); and Authors_per_Paper (ratio of authors per paper). The result of applying those metrics on the 34 editions of ER is shown in Table 1. The table also includes the trend of the metric value along the editions. To measure metric trends we compute the Spearman correlation (ρ) between the value of the metric in each edition and the time axis. Spearman correlation allows us to quantify monotone trends: as the time axis is monotonically increasing, strong corre- lation indicates presence of a trend in the metric. It is interesting to note the remarkable positive trend for the metrics Num_authors and Authors_per_Paper.
Among all possible general metrics, we believe the ones related to conference open- ness, measuring how easy is for new researchers to become part of the community, are of special interest. For this, we use the metrics Newcomers (percentage of authors who are new to the conference in each edition, an author is new when she has not published a full paper in the previous 5 editions), Newcomer_papers (papers authored by only newcomers), Community_papers (papers where no newcomer author participated) and Mixed_papers (the rest). Last four rows in Table 1 shows the summary statistics of the results of these metrics. The moderate negative trend on the metric Newcomers and the positive trend for the metric may reveal that new authors are joining the conference with the help of community members.
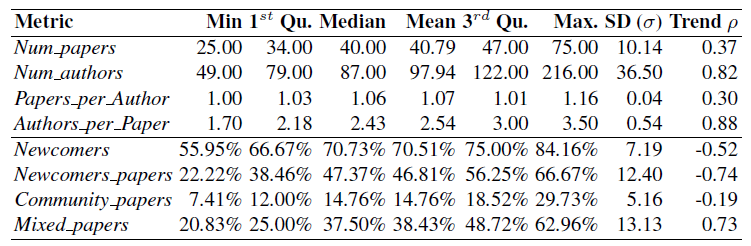
Table 1. Summary of the metric values.
Authorship Analysis
We propose to study the authorship relations among the authors by means of building a global co-authorship graph with information from all the editions of a conference. In this kind of graphs, authors who have published a paper in the conference are represented as nodes while co-authorship is represented as an edge between the involved author nodes. Weight of nodes and edges represent the number of papers and number of coauthorship of the authors represented by those nodes, respectively. Figure 6 shows the co-authorship graph for the ER conference. The graph includes 2,158 nodes (i.e., unique authors) and 3,766 edges (i.e., co-authorship relations).
Once we have this graph, a number of graph-based metrics can be calculated to get a feeling of the collaboration patterns of the ER community. For instance, the average degree is 3.49, the average path length is 8.042 and there are 460 connected components (each connected component identifies a sub-community of authors that work together). Most of the components (394 in total) are composed by 1 to 4 author nodes but there is one component (sub-graph with black-filled nodes) that includes 828 author nodes (almost 40% of the total number of authors), thus revealing the main core of authors in the conference and showing they tend to work together at least from time to time instead of ER being the composition of a set of isolated groups.
To expand on this, we also calculated the betweenness centrality value for each node, which measures the number of shortest paths between any two nodes that pass through a particular node and allows to identify prominent authors in the community that act as bridges between group of authors. The author node with the highest betweenness centrality value is John Mylopoulos (largest black node in the graph, tagged with the value 1), followed by Juan Carlos Trujillo (node tagged with number 2) and Veda C. Storey (node tagged with number 3). John Mylopoulos also has 5 as average distance to other authors within its connected component. Finally, we also measured the graph density, which is the relative fraction of edges in the graph, that is, the ratio between the actual number of edges (actual collaboration values) and the maximum number of possible edges in the graph (potential collaboration relationships). In our graph, the graph density is 0.002, which is a very low value.
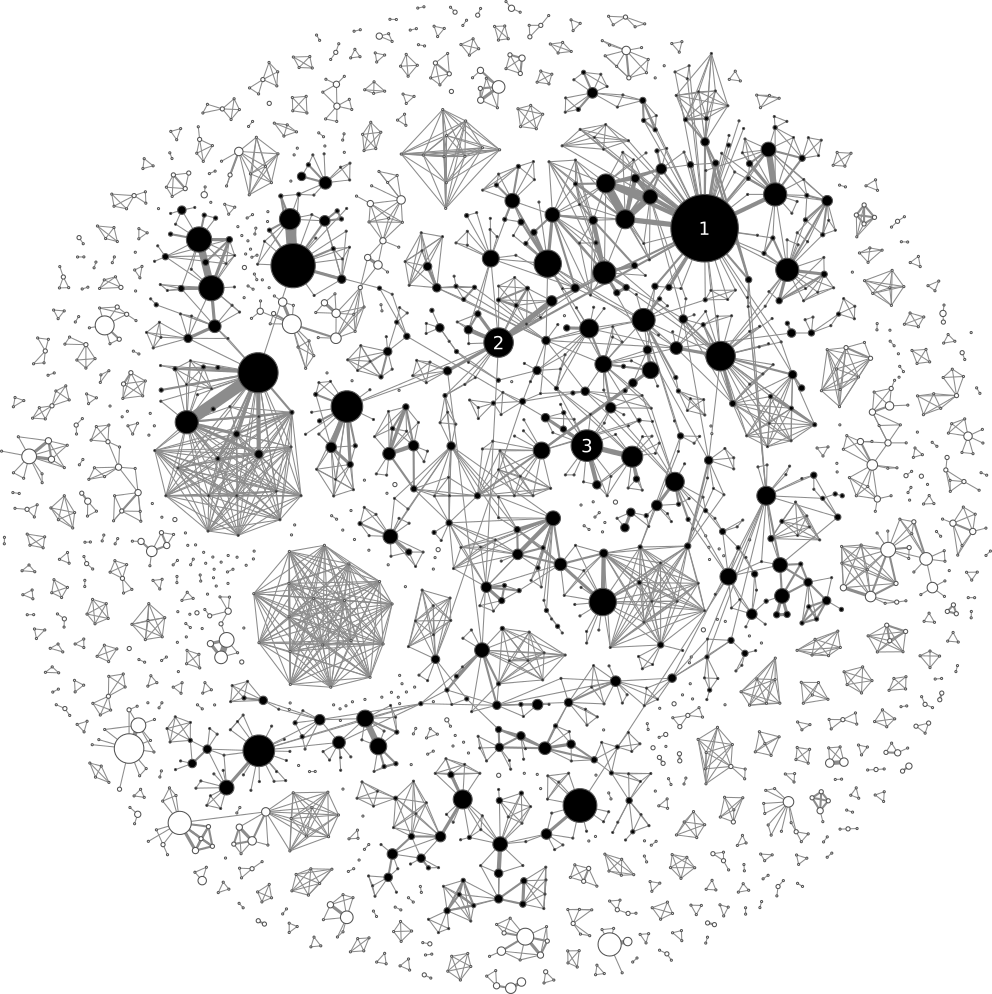
Fig. 6. Co-authorship graph for all the editions of the ER conference. Numbered nodes represent the three nodes with the highest betweenness centrality value: (1) John Mylopoulos, (2) Juan Carlos Trujillo and (3) Veda C. Storey.
Fig. 6. Co-authorship graph for all the editions of the ER conference. Numbered nodes represent the three nodes with the highest betweenness centrality value: (1) John Mylopoulos, (2) Juan Carlos Trujillo and (3) Veda C. Storey.
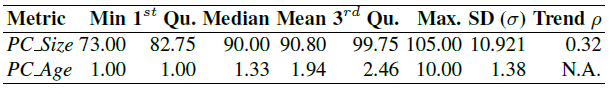
Table 2. Summary for the metrics PC Size and PC Age.
Program Committee Analysis
This is one of the least explored areas due to the challenges other authors found to automatically collect PC information in the past (i.g., [5–7]). With our approach, data regarding the PC can be leveraged to calculate PC evolution metrics like (1) PC_Size (size of the PC per conference edition) or (2) PC_Age (number of consecutive editions for which a researcher has been member of the PC). Table 2 shows the results for these metrics for the last 10 editions of the ER conference. It is worth noting that the minimum and maximum sizes of the PC are 73 (in 2010) and 105 (in 2013), respectively. On the other hand, only 2 members (i.e., Barbara Pernici and Il-Yeol Song) stayed as part of the PC for the last 10 editions.
METASCIENCE can also help in deciding who should become part of the PC and choose the PC Chairs. For instance, we define the metrics (1) Inactive_Members (number of PC members that have not published a paper in the previous 3 editions); and (2) Active_Authors (counting the number of authors who have published in each of the previous 3 conference editions and are not yet PC members). When applying these metrics on the 2015 conference edition. we have that Inactive_Members reports that 60 out of the 99 members in the PC from 2015 did not publish in the previous 3 editions (a high value, though some of them did publish in workshops or had other responsibilities). The metric Active_Authors tells us that only 7 researchers published constantly from 2012 to 2014 and from them only 3 were PC members in 2015, while the remaining 4 were not (but some of their co-authors were, which at least indicates that their expertise was somehow represented).

Fig. 7. Comparison between the top 30 keywords extracted from (a) paper abstracts and (b) topics of interest, for the last 10 editions of the ER conference.
Topics Analysis
Information regarding the topics of interest can be used to study the main working areas of a conference. We believe it is specially interesting to compare the theoretical list of topics (those published in the call for papers) with the actual list of topics (those addressed by accepted papers, inferred from the analysis of their titles and abstracts). This information is useful to gauge the actual interest of topics by the community and use that when deciding on the conference evolution path (e.g., what topics to cover in the future).
Figure 7 shows a visual comparison between the tag clouds of keywords extracted from (a) the paper abstracts published in the last 10 editions of ER and (b) the topics of interests of the corresponding conference editions. For the sake of clarity, the generated clouds include the top 30 keywords. As can be seen, keywords such model, modeling and data, which can be considered part of the core concepts of the conference, are representative for both clouds. Instead, keywords process and business appear to be more relevant in actual papers than they are in the call for papers, while keywords enterprise and reverse only appear in the conference topics but no paper tackled them directly. This analysis reveals a possible discrepancy between the conference topics and the actual trend in the paper topics. Surprisingly enough, the relevance of the keywords ontology and web seem to point out that the corresponding topics receive little attention from both conference and papers.
Tool Support
All artifacts developed in this paper for the extraction process and the metrics calcu- lation are available in the METASCIENCE repository . The steps to initialize, enrich and update the database have been implemented in Python 2.7.6. The crawlers rely on Selenium, a portable software testing framework tuned to collect information from con- ference web pages and digital libraries, while the database integrated in METASCIENCE uses MySQL. We also developed a free online service that leverages part of the presented infrastructure to offer individual research reports.
Related Work
There are several online services offering basic bibliographic data on CS conferences and journals like DBLP, ACM Portal, CiteSeerX and IEEE Xplore. Platforms such as ResearchGate and Academia.edu provide social networks that allow researchers to dis- seminate their work and measure their impact according to basic publication statistics (e.g., co-author index, citation count, publication count). Other services provide more complex bibliometrics information. Arnetminer extracts and mines academic social networks, Google Scholar provides bibliometric analysis of the research performance of individuals and papers, as well as rating and ranking for journals and conferences, while Microsoft Academic Search offers information about institutions and fields of study for researchers, conferences and journals. However, each of them focuses on part of the information that is required to perform a complete conference analysis (e.g., none of them integrates information about program committees, topics of interest or its core ranking) with different degrees of completeness.
Once the conference information is gathered, several authors have proposed metrics to analyze the data. The most common form to assess a conference quality is through citation analysis [8–11]. Since exclusive focus on citation analysis is controversial [12, 13], other authors have proposed additional metrics taking into account other aspects such as program committee members [6] and co-authorship networks [14]. For instance, [5] determines the health of a small set of software engineering conferences by com- bining several metrics such as openness to new authors, introversion/inbreeding and program committee turnover. Nevertheless, these analysis are limited in terms of the scope and the number of metrics since they are forced to manually extract part of the data. In contrast, our infrastructure would make this analysis scalable and offer the chance to quickly come up with new metrics combining richer data sources as shown in the previous sections. A similar approach to ours with regard to the analysis of conferences was presented in [15] but focused on the co-authorship graphs and citations of the CAiSE conference, some of their metrics could be integrated in our approach to make them available to any other conference.
Conclusion
In this paper we have presented a conceptual schema for the integrated analysis of con- ference research activities. Based on this schema, we have devised a database-driven infrastructure incrementally populated with data coming from different heterogeneous sources (DBLP, CORE rankings, web scraping on conference websites, etc.). This in- formation enables the definition of a variety of complex metrics mixing the different sources information and their automatic calculation on a large set of CS conferences. In particular, we have illustrated these metrics via the analysis of this own ER conference to shed some light on its co-authorship graph, PC membership and topics of interest.
As future work, we would like to extend this work to journal analysis and inte- grate additional information sources (e.g., PubMed) to tackle areas outside CS. This would enable comparing typical values of CS conferences (which themselves should also be compared based on their subfields) with, for instance, biology ones. We will also work on the extension of our heuristics for web scraping to increase their success rate (currently around 70% on average of conference websites we have tested can be automatically parsed, while the rest require small tunings on the initial generated con- figuration), a better suppport for semantic analysis when studying the topics and the use of other quality indicator services (e.g., GII-GRIN). Finally, we plan to use our data to conduct an exhaustive study of research conferences and work with SC members to interpret the results in order to (1) help them take corrective actions if needed and (2) consolidate a set of metrics that we see useful across fields in order to use them as quick and public summary of key performance indicators of conferences.
References
- Patterson, D.A.: The Health of Research Conferences and the Dearth of Big Idea Papers. Commun. ACM 47(12) (2004) 23–24
- Chen, J., Konstan, J.A.: Conference Paper Selectivity and Impact. Commun. ACM 53(6) (2010) 79–83
- Goeminne, M., Mens, T.: A Comparison of Identity Merge Algorithms for Software Repos- itories. Sci. Comput. Program. 78(8) (2013) 971–986
- Christen, P.: A Comparison of Personal Name Matching: Techniques and Practical Issues. In: ICDM conf. (2006) 290–294
- Vasilescu, B., Serebrenik, A., Mens, T., van den Brand, M.G., Pek, E.: How Healthy are Software Engineering Conferences? Sci. Comput. Program. 89 (2014) 251–272
- Zhuang, Z., Elmacioglu, E., Lee, D., Giles, C.L.: Measuring conference quality by mining program committee characteristics. In: Digital libraries conf. (2007) 225–234
- Vasilescu, B., Serebrenik, A., Mens, T.: A Historical Dataset of Software Engineering Con- ferences. In: MSR conf. (2013) 373–376
- Hirsch, J.E.: An Index to Quantify an Individual’s Scientific Research Output. Natl. Acad. Sci. USA. 102(46) (2005) 16569–16572
- Amin, M., Mabe, M.: Impact Factors: Use and Abuse. I. J. Environ. Sci. Tech. 1(1) (2004) 1
- Martins, W.S., Gonc¸alves, M.A., Laender, A.H., Ziviani, N.: Assessing the Quality of Sci- entific Conferences based on Bibliographic Citations. Scientometrics 83(1) (2010) 133–155
- Van Eck, N.J., Waltman, L.: CitNetExplorer: A new software tool for analyzing and visual- izing citation networks. J. Informetrics 8(4) (2014) 802–823
- Saha, S., Saint, S., Christakis, D.A.: Impact Factor: a Valid Measure of Journal Quality? J. Med. Libr. Assoc. 91(1) (2003) 42
- Bornmann, L., Daniel, H.D.: Does the H-index for Ranking of Scientists Really Work? Scientometrics 65(3) (2005) 391–392
- Montolio, S.L., Dominguez-Sal, D., Larriba-Pey, J.L.: Research Endogamy as an Indicator of Conference Quality. ACM SIGMOD Rec. 42(2) (2013) 11–16
- Jarke, M., Pham, M.C., Klamma, R.: Evolution of the CAiSE Author Community: A Social Network Analysis. In: Seminal Contributions to Information Systems Engineering, 25 Years of CAiSE. (2013) 15–33
I’m Valerio Cosentino, a postdoctoral fellow in the SOM Research Lab at IN3 UOC, in Barcelona, Spain. My research interests are mainly focused on source code analysis, Model-Driven Engineering (MDE) and Model-Driven Reverse Engineering (MDRE). In the last years, I have been working on the analysis of OSS projects and their communities.


Recent Comments