
Lucidchart is one of the most popular online modeling tools. Lucidchart is built with open web standards and offers real-time collaboration, integration with many other tools (Google Drive, Office 365, JIRA, Confluence, Slack) and support for the most popular modeling notations like ER, BPMN, and UML.
We first covered Lucidchart a couple of years ago but since then Lucid Software (company behind Lucidchart) has grown in revenue by over 100 percent each year and, more importantly, it recently raised 36 million dollars to fund its expansion, joining the very few software modeling companies to raise a significant amount of external funding (the others being OutSystems and Mendix). I think this is a good excuse to revisit Lucidchart, see how it has evolved since then, and what the roadmap for the tool looks like.
 Dave Grow, Chief Operating Officer at Lucid, will be joining us to answer these and other questions about Lucidchart. Enjoy!
Q – Your investment round seems to confirm the growing interest for online diagramming / modeling tools. My own personal feeling is that web-based tools offer a very good trade-off for the increasing market of software teams looking for a “lightweight” modeling solution (in contrast to more powerful full-fledged MDE environments with a steeper learning curve and offering additional services, like code-generation or creation of new domain-specific languages, that they may not be interested in). Would you agree ? How do you position Lucidchart in the global domain on model-driven engineering tools?
A – I strongly agree. Most software teams are open to embracing a lighter solution that also provides the benefits of collaboration, access everywhere, etc. Most of the value comes from not only designing new systems and features, but also aligning teams around those designs and plans. Unlike those traditional tools, Lucidchart provides a solution that makes it easy to create, collaborate and align.
Q – Let’s start from the beginning: Why Lucidchart? Why did you decide to create this tool? What problem were you trying to solve? Why did you choose as your motto the sentence “Diagrams done right” ?
A – Lucidchart was originally designed by our CTO and co-founder Ben Dilts because he experienced the pain of working with Visio. He and his team were mapping out some complex systems and processes in a prior startup, but they only had 1 copy of Visio. This meant one person would make the changes, PDF and email it out to everyone, and wait for handwritten notes or emailed comments to come back.
Ben figured there had to be a better way than this, so he went searching for an existing product that provided collaboration. While there were a couple tools out there, none were built with collaboration in mind, so he started building Lucidchart.
“Diagrams done right” describes that Lucidchart accomplishes a couple of things. First, it’s easy. Plain and simple. Unlike traditional tools, Lucidchart allows anyone to quickly and efficiently create great diagrams. Second, it’s collaborative. Many diagrams are not simply for of the creator — they are meant to be shared and consumed by others.
Q – What have been the major changes since we last wrote about Lucidchart two years ago?
Wow, where to start? It’s worth noting that we have an incredible engineering team of dozens of engineers and we actually ship new code every two weeks, so there are a lot of new things coming to customers on a regular basis.
In the last couple years, we’ve expanded the ability to use Lucidchart anywhere. For example, we’ve released an iOS app (for iPhone and iPad) which has become very popular and has been featured by Apple several times; we are also currently working on an Android app. Also, we have integrated with other great products like Microsoft Office 365, Slack and Hipchat (to go along with the previous integrations of GSuite & Google Drive, Confluence, JIRA, etc.).
Also, we’ve made it much easier to create lots of various types of diagrams. For example, many people use Lucidchart to draw network diagrams, including those for Amazon Web Services; to help users do this faster, we released an AWS import to help create those AWS architecture diagrams. We’ve also made it easier to automatically create ER diagrams by importing your existing database structure; similarly, you can also export ERD to SQL. And with UML diagrams, we’ve released a markup tool to simplify the creation of sequence diagrams. These are just a few examples!
The other major changes have been focused on developing our Enterprise product. Through integrations with single-sign on providers like Okta and Ping Identity, a robust dashboard that provides administrative settings, and countless security settings, Lucidchart is now the only web-based diagramming application that is positioned to serve companies of every size, including large enterprises.
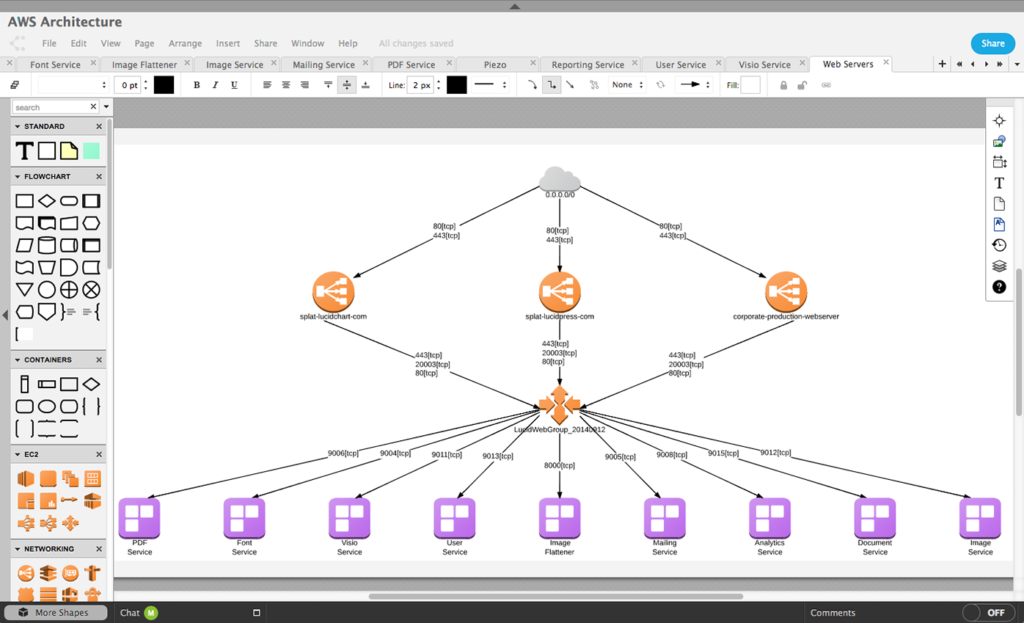
Modeling AWS architectures in Lucidchart
Q – In your opinion, what makes Lucidchart stand out among the other diagramming tools? Who are your main competitors?
A – Our main competitors are (1) Microsoft Visio; (2) other programs like Microsoft Powerpoint; and (3) the whiteboard. Microsoft Visio has been around a long time and is the only diagramming competitor we regularly hear about. But since Microsoft bought Visio 16 years ago, it has experienced very little innovation.
So, one of our opportunities is to win over customers who are excited about a web-based, collaborative, accessible everywhere product like Lucidchart. This is happening at an accelerating level as many of the world’s leading companies are switching from Visio to Lucidchart. In fact, we have now imported millions of Visio files from customers making that exact switch.
Then, the next major opportunity is to win over users who have never used a diagramming tool before. Perhaps they have suffered through Powerpoint for diagramming or perhaps they have only sketched out diagrams on a whiteboard. By helping these users understand the value of an intuitive, fast diagramming experience that Lucidchart provides, we can significantly grow the market. We see this happening at a regular basis as ~40% of our paying users have never used a diagramming tool before!
Q – Why did you decide to raise funding now? What will this money be used for?
A – Lucidchart has been growing at an incredible pace, more than 100% each year. As a result, we continue to see some amazing opportunities to invest. First, we intend to invest in additional product development, we’ve got some tricks up our sleeves that we’re not ready to discuss publicly quite yet but will help users create diagrams much faster.
Second, we will continue to grow our marketing and sales efforts. As I mentioned earlier, many of the world’s leading companies are switching to Lucidchart and we continue to see amazing opportunities to grow these efforts.
Finally, we plan to rapidly expand internationally by localizing the product in various languages, as well as our marketing and sales.
Q – Can you share some numbers about how many users does Lucidchart have right now? Or how many diagrams are created each day?
A – Lucidchart has more than 7 million users now, with hundreds of thousands of new users every month.
Q – What is the most popular notation? Is the ER language still popular? At first, I thought UML (in particular, its class-diagram type) would end up killing it but I guess this is not going to happen anytime soon.
A – We currently have about 3x the users using UML diagrams than ER diagrams, but we still have a very large number of users using our ERD library. In fact, with the automated ER diagramming I mentioned earlier, this is growing at an exciting pace.
Q – At the tool level, what is the roadmap for Lucidchart? What new features can we expect in the future?
A – There are some exciting things coming down the pipeline. First, as I mentioned earlier, many users will now be able to experience Lucidchart in their native language as we localize the product.
Second, we are working on a new design for the core editing experience. Hundreds of thousands of users have helped us test this new design and we are excited to be rolling it out to all users in the next few months.
Finally, I wish I could share more but we are keeping a few things confidential for strategic reasons, but users will be really excited about some of the exciting innovations that we’ll be sharing with users in the not-too-distant future.
Q – What are the most complex components in Lucidchart? Is Lucidchart investing in cutting-edge research activities around them? (e.g. in developing better layouts algorithms to automatically position graphical elements in a diagram?). If so, is this done internally or in collaboration with research teams in universities / labs?
A – The most complex components in Lucidchart relate to scaling the application up, and scaling the application down.
Our best and most active users draw diagrams of incredible complexity. We often see diagrams containing thousands of individual objects, and sometimes tens of thousands of objects. Developing software to efficiently display and interact with content of that complexity, from within the difficult constraints available to us in a web browser, requires constant innovation. Over the course of the last three years, we’ve completely re-architected our diagram display engine twice, and our interaction engine once. Diagrams that simply crashed browsers a few years ago now operate smoothly.
On the opposite end of the spectrum, we need to scale our application down to work smoothly on mobile devices, which have a tiny fraction of the processing power and memory available on a laptop or desktop computer. Last year we rolled out a rendering engine based on WebGL that allowed fast, smooth interaction with most diagrams even on very modest devices like the iPad 2. And we had to reconsider our entire user interface for touch interaction, where pointing precision is very low and the user’s hand physically occludes the screen while they work.
All of this work has been done in-house, often by dedicated research teams for specific projects.
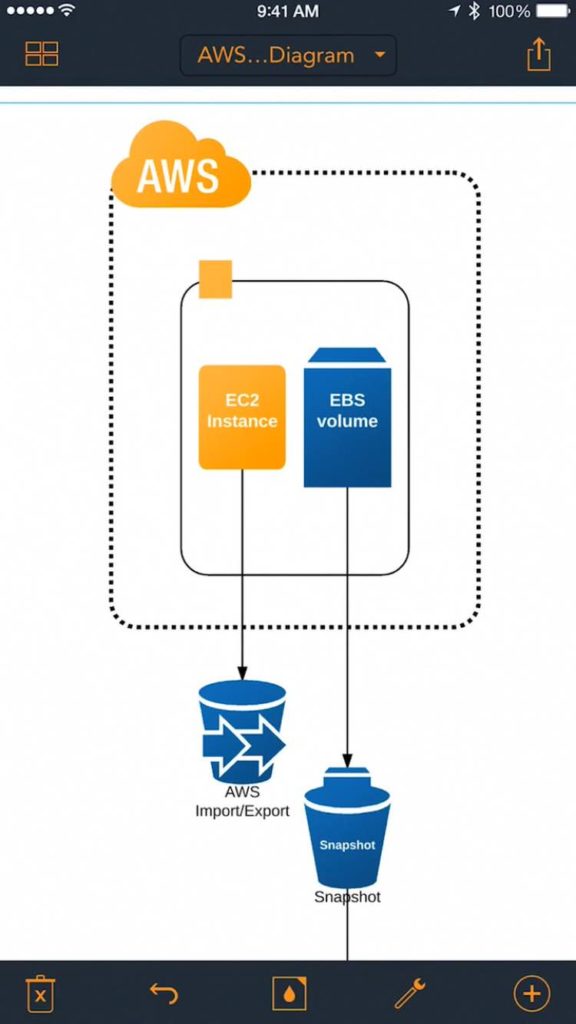
Modeling on a mobile device with Lucidchart
Q – To wrap up, as a kind of meta question, I think our readers will also be interested in knowing more about how Lucidchart itself is developed. Can you comment on this? (e.g. software methods used internally, tool architecture, how you decide on the new features to implement or new notations to support….)?
A – We have about 12 engineering teams of 3-7 people, all running two-week Scrum sprints, with demos and retrospectives at the end of each sprint. Teams have a lot of autonomy in doing their work. There may be a high-level goal like increasing users’ engagement with a certain feature or driving a certain amount of revenue through an experiment, and a team would come up with their own roadmap for achieving that. A lot of the features end up on the roadmap simply because our customers told us they want them. The autonomy also means the accountability for the outcome. The entire team actively participates in sprint and quarterly planning meetings that often also involve experts from other departments (business, sales, marketing, ux) to better assess dependencies and risks. A team is also responsible for monitoring user feedback and certain analytics metrics after their code is released and making adjustments accordingly. Such an environment really encourages ownership over components and features and challenges individuals to take initiative and make meaningful contributions to the success of our business.
Our technology stack. We have Scala code on the back-end and we use Play 2 web framework. At a high level, our application looks like a set of micro-services that interact with each other using a variation of a hypermedia (HATEOAS) approach. On the front-end, we have lots, lots of JavaScript, built and optimized by the Google Closure compiler and a few other tools. The central piece of our diagram editor is the HTML5 canvas with a home-grown high-performance rendering framework that gives us full control over all the drawing and interactions. Where supported, we use WebGL rendering to ensure the highest framerate even on fairly complex documents. The rest of the app UI (chrome) is handled by a combination of custom-built libraries, AngularJS and Angular 2. With the adoption of Angular 2, we’ve also been transitioning our code to TypeScript that gives us additional type safety, a more concise code and the ability to use the latest EcmaScript features available in the browsers. We use LESS for stylesheets. To ensure efficient project collaboration, we use JIRA, Confluence, Bitbucket, Slack, G Suite, Zepplin and others. For more details on the languages, tools and services that we use, see our entry on stackshare.
FNR Pearl Chair. Head of the Software Engineering RDI Unit at LIST. Affiliate Professor at University of Luxembourg. More about me.


Recent Comments